Big Lots 2015 Annual Report Download - page 95
Download and view the complete annual report
Please find page 95 of the 2015 Big Lots annual report below. You can navigate through the pages in the report by either clicking on the pages listed below, or by using the keyword search tool below to find specific information within the annual report.-
 1
1 -
2
-
3
-
4
-
5
-
6
-
7
-
8
-
9
-
10
-
11
-
12
-
13
-
14
-
15
-
16
-
17
-
18
-
19
-
20
-
21
-
22
-
23
-
24
-
25
-
26
-
27
-
28
-
29
-
30
-
31
-
32
-
33
-
34
-
35
-
36
-
37
-
38
-
39
-
40
-
41
-
42
-
43
-
44
-
45
-
46
-
47
-
48
-
49
-
50
-
51
-
52
-
53
-
54
-
55
-
56
-
57
-
58
-
59
-
60
-
61
-
62
-
63
-
64
-
65
-
66
-
67
-
68
-
69
-
70
-
71
-
72
-
73
-
74
-
75
-
76
-
77
-
78
-
79
-
80
-
81
-
82
-
83
-
84
-
 85
85 -
 86
86 -
 87
87 -
 88
88 -
 89
89 -
 90
90 -
 91
91 -
 92
92 -
 93
93 -
 94
94 -
 95
95 -
 96
96 -
 97
97 -
 98
98 -
 99
99 -
 100
100 -
 101
101 -
 102
102 -
 103
103 -
 104
104 -
 105
105 -
106
-
107
-
108
-
109
-
110
-
111
-
112
-
113
-
114
-
115
-
116
-
117
-
118
-
119
-
120
-
121
-
122
-
123
-
124
-
125
-
126
-
127
-
128
-
129
-
130
-
131
-
132
-
133
-
134
-
135
-
136
-
137
-
138
-
139
-
140
-
141
-
142
-
143
-
144
-
145
-
146
-
147
-
148
-
149
-
150
-
151
-
152
-
153
-
154
-
155
-
156
-
157
-
158
-
159
-
160
-
161
-
162
-
163
-
164
-
165
-
166
 |
 |

18
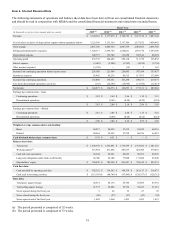
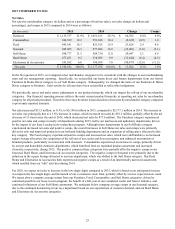
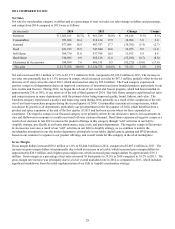
Item 6. Selected Financial Data
The following statements of operations and balance sheet data have been derived from our consolidated financial statements
and should be read in conjunction with MD&A and the consolidated financial statements and related notes included herein.
Fiscal Year
(In thousands, except per share amounts and store counts) 2015 (a) 2014 (a) 2013 (a) 2012 (b) 2011 (a)
Net sales $ 5,190,582 $ 5,177,078 $ 5,124,755 $ 5,212,318 $ 5,097,144
Cost of sales (exclusive of depreciation expense shown separately below) 3,123,396 3,133,124 3,117,386 3,157,632 3,058,442
Gross margin 2,067,186 2,043,954 2,007,369 2,054,686 2,038,702
Selling and administrative expenses 1,708,717 1,699,764 1,664,031 1,639,770 1,594,346
Depreciation expense 122,737 119,702 113,228 103,146 88,324
Operating profit 235,732 224,488 230,110 311,770 356,032
Interest expense (3,683) (2,588) (3,293) (4,184) (2,738)
Other income (expense) (5,199) — (12) 2 163
Income from continuing operations before income taxes 226,850 221,900 226,805 307,588 353,457
Income tax expense 83,842 85,239 85,515 117,071 133,880
Income from continuing operations 143,008 136,661 141,290 190,517 219,577
Loss from discontinued operations, net of tax (135) (22,385) (15,995) (13,396) (12,513)
Net income $ 142,873 $ 114,276 $ 125,295 $ 177,121 $ 207,064
Earnings per common share - basic:
Continuing operations $ 2.83 $ 2.49 $ 2.46 $ 3.18 $ 3.21
Discontinued operations — (0.41) (0.28) (0.22) (0.18)
$ 2.83 $ 2.08 $ 2.18 $ 2.96 $ 3.03
Earnings per common share - diluted:
Continuing operations $ 2.81 $ 2.46 $ 2.44 $ 3.15 $ 3.16
Discontinued operations — (0.40) (0.28) (0.22) (0.18)
$ 2.80 $ 2.06 $ 2.16 $ 2.93 $ 2.98
Weighted-average common shares outstanding:
Basic 50,517 54,935 57,415 59,852 68,316
Diluted 50,964 55,552 57,958 60,476 69,419
Cash dividends declared per common share $ 0.76 $ 0.51 $ — $ — $ —
Balance sheet data:
Total assets $ 1,640,370 $ 1,635,891 $ 1,739,599 $ 1,753,626 $ 1,641,310
Working capital (c) 315,984 411,446 483,833 423,300 379,052
Cash and cash equivalents 54,144 52,261 68,629 60,581 68,547
Long-term obligations under bank credit facility 62,300 62,100 77,000 171,200 65,900
Shareholders’ equity $ 720,470 $ 789,550 $ 901,427 $ 758,142 $ 823,233
Cash flow data:
Cash provided by operating activities $ 342,352 $ 318.562 $ 198,334 $ 281,133 $ 318,471
Cash used in investing activities $ (113,193) $ (90,749) $ (97,495) $ (130,357) $ (120,712)
Store data:
Total gross square footage 44,914 45,134 45,708 45,505 43,932
Total selling square footage 31,775 32,006 32,732 32,623 31,512
Stores opened during the fiscal year 9 24 55 87 92
Stores closed during the fiscal year (20) (57) (57) (43) (39)
Stores open at end of the fiscal year 1,449 1,460 1,493 1,495 1,451
(a) The period presented is comprised of 52 weeks.
(b) The period presented is comprised of 53 weeks.