Ford 2005 Annual Report Download - page 104
Download and view the complete annual report
Please find page 104 of the 2005 Ford annual report below. You can navigate through the pages in the report by either clicking on the pages listed below, or by using the keyword search tool below to find specific information within the annual report.-
 1
1 -
2
-
3
-
4
-
5
-
6
-
7
-
8
-
9
-
10
-
11
-
12
-
13
-
14
-
15
-
16
-
17
-
18
-
19
-
20
-
21
-
22
-
23
-
24
-
25
-
26
-
27
-
28
-
29
-
30
-
31
-
32
-
33
-
34
-
35
-
36
-
37
-
38
-
39
-
40
-
41
-
42
-
43
-
44
-
45
-
46
-
47
-
48
-
49
-
50
-
51
-
52
-
53
-
54
-
55
-
56
-
57
-
58
-
59
-
60
-
61
-
62
-
63
-
64
-
65
-
66
-
67
-
68
-
69
-
70
-
71
-
72
-
73
-
74
-
75
-
76
-
77
-
78
-
79
-
80
-
81
-
82
-
83
-
84
-
85
-
86
-
87
-
88
-
89
-
90
-
91
-
92
-
93
-
 94
94 -
 95
95 -
 96
96 -
 97
97 -
 98
98 -
 99
99 -
 100
100 -
 101
101 -
 102
102 -
 103
103 -
 104
104 -
 105
105 -
 106
106 -
 107
107 -
 108
108
 |
 |

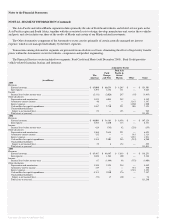
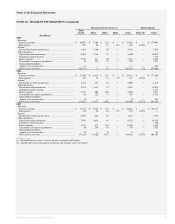
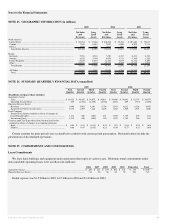
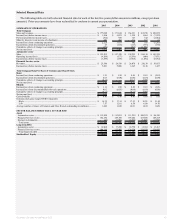
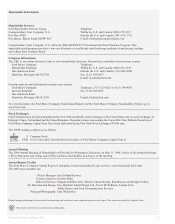
Employment Data
The approximate number of individuals employed by us and our consolidated entities (including entities we do not control) at
December 31, 2005 and 2004 was as follows (in thousands):
2005 2004*
Business Unit
Automotive Sector
The Americas
Ford North America ................................................................................................................................................................
......
140 126
Ford South America ................................................................................................................................................................
......
13 12
Ford Europe and PAG
Ford Europe................................................................................................................................................................
..................
66 69
PAG ................................................................................................................................................................
.............................
49 51
Ford Asia Pacific and Africa................................................................................................................................
............................
18 18
Financial Services Sector
Ford Motor Credit Company................................................................................................................................
............................
14 18
The Hertz Corporation................................................................................................................................................................
.....
—31
Total................................................................................................................................................................
..........................
300 325
* Employment figures for 2004 have been adjusted to conform to 2005 business unit presentation.
As shown in the employment data above, from December 31, 2004 to December 31, 2005, the number of people we employed
decreased approximately eight percent. This decrease primarily reflects the sale of Hertz, partially offset by the formation of ACH
which employs approximately 17,700 Ford hourly workers who were previously assigned to Visteon and approximately 2,500 former
Visteon employees. Not included in these employment data are approximately 5,000 Visteon salaried workers leased to ACH. See
Management's Discussion and Analysis of Financial Condition and Results of Operations – Overview and Notes 4 and 23 of the Notes
to the Financial Statements for additional discussion relating to the Visteon transaction and ACH.
Ford Motor Company Annual Report 2005 102 Ford Motor Company Annual Report 2005 103