Ford 2005 Annual Report Download - page 36
Download and view the complete annual report
Please find page 36 of the 2005 Ford annual report below. You can navigate through the pages in the report by either clicking on the pages listed below, or by using the keyword search tool below to find specific information within the annual report.-
 1
1 -
2
-
3
-
4
-
5
-
6
-
7
-
8
-
9
-
10
-
11
-
12
-
13
-
14
-
15
-
16
-
17
-
18
-
19
-
20
-
21
-
22
-
23
-
24
-
25
-
 26
26 -
 27
27 -
 28
28 -
 29
29 -
 30
30 -
 31
31 -
 32
32 -
 33
33 -
 34
34 -
 35
35 -
 36
36 -
 37
37 -
 38
38 -
 39
39 -
 40
40 -
 41
41 -
 42
42 -
 43
43 -
 44
44 -
 45
45 -
 46
46 -
47
-
48
-
49
-
50
-
51
-
52
-
53
-
54
-
55
-
56
-
57
-
58
-
59
-
60
-
61
-
62
-
63
-
64
-
65
-
66
-
67
-
68
-
69
-
70
-
71
-
72
-
73
-
74
-
75
-
76
-
77
-
78
-
79
-
80
-
81
-
82
-
83
-
84
-
85
-
86
-
87
-
88
-
89
-
90
-
91
-
92
-
93
-
94
-
95
-
96
-
97
-
98
-
99
-
100
-
101
-
102
-
103
-
104
-
105
-
106
-
107
-
108
 |
 |

Managementʼs Discussion and Analysis of Financial
Condition and Results of Operations
Hertz Operating Results
The improvement in Hertz operating results primarily reflected the cessation of depreciation on long-lived assets from the point
Hertz was held for sale (i.e., September 2005) until it was sold, higher car and equipment rental volumes and improved pricing for
equipment rental.
Other Financial Services Operating Results
The decrease in earnings primarily reflected the non-recurrence of a 2004 property clean-up settlement, and, in 2005, lower
property sales and the write-off of aircraft leases related to the bankruptcy of Delta Air Lines.
2004 Compared with 2003
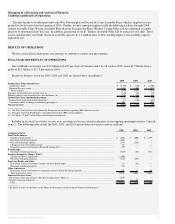
Details of the full-year Financial Services sector Income/(loss) before income taxes for 2004 and 2003 are shown below (in
millions):
Income/(Loss)
Before Income Taxes
2004 2003
2004
Over/(Under)
2003
Ford Credit................................................................................................................................................................................. $ 4,431 $ 2,956 $ 1,475
Hertz* ........................................................................................................................................................................................ 493 228 265
Other Financial Services ........................................................................................................................................................... 84 63 21
Total Financial Services sector ............................................................................................................................................... $ 5,008 $ 3,247 $ 1,761
__________
* Includes amortization expense related to intangibles recognized upon consolidation of Hertz.
Ford Credit
The increase in income before income taxes primarily reflected improved credit loss performance and improved leasing results.
The improved credit loss performance primarily resulted from fewer repossessions and a lower average loss per repossession. The
improvement in leasing results primarily reflected higher used vehicle prices and a reduction in the percentage of vehicles returned to
Ford Credit at lease termination.
Hertz
The improvement in earnings primarily reflected higher vehicle and equipment rental volumes, lower fleet costs and higher
proceeds received in excess of book value on the disposal of used vehicle and equipment, offset partially by lower pricing.
LIQUIDITY AND CAPITAL RESOURCES
Automotive Sector
Our strategy is to ensure we have sufficient funding available with a high degree of certainty throughout the business cycle. The
key elements of this strategy include maintaining large gross cash balances, generating cash from operating-related activities, having a
long-dated debt maturity profile, maintaining committed credit facilities and funding long-term liabilities over time.
Ford Motor Company Annual Report 2005 34 Ford Motor Company Annual Report 2005 35