Ford 2005 Annual Report Download - page 30
Download and view the complete annual report
Please find page 30 of the 2005 Ford annual report below. You can navigate through the pages in the report by either clicking on the pages listed below, or by using the keyword search tool below to find specific information within the annual report.-
 1
1 -
2
-
3
-
4
-
5
-
6
-
7
-
8
-
9
-
10
-
11
-
12
-
13
-
14
-
15
-
16
-
17
-
18
-
19
-
 20
20 -
 21
21 -
 22
22 -
 23
23 -
 24
24 -
 25
25 -
 26
26 -
 27
27 -
 28
28 -
 29
29 -
 30
30 -
 31
31 -
 32
32 -
 33
33 -
 34
34 -
 35
35 -
 36
36 -
 37
37 -
 38
38 -
 39
39 -
 40
40 -
41
-
42
-
43
-
44
-
45
-
46
-
47
-
48
-
49
-
50
-
51
-
52
-
53
-
54
-
55
-
56
-
57
-
58
-
59
-
60
-
61
-
62
-
63
-
64
-
65
-
66
-
67
-
68
-
69
-
70
-
71
-
72
-
73
-
74
-
75
-
76
-
77
-
78
-
79
-
80
-
81
-
82
-
83
-
84
-
85
-
86
-
87
-
88
-
89
-
90
-
91
-
92
-
93
-
94
-
95
-
96
-
97
-
98
-
99
-
100
-
101
-
102
-
103
-
104
-
105
-
106
-
107
-
108
 |
 |

Managementʼs Discussion and Analysis of Financial
Condition and Results of Operations
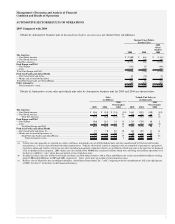
Details of Automotive sector market share for selected markets for 2005 and 2004 are shown below:
Dealer-Owned Stocks (a)
Market Share (in thousands)
Market 2005 2004
2005
Over/(Under)
2004 2005 2004
2005
Over/(Under)
2004
U.S. (b) ................................................... 17.0% 18.0% (1.0) pts. 733 794 (61)
Brazil (b)................................................. 12.4 11.8 0.6 18 19 (1)
Europe (b) (c) ......................................... 8.5 8.6 (0.1) 342 356 (14)
PAG - U.S./Europe (c) .......................... 1.2/2.3 1.3/2.3 (0.1)/0 45/69 41/68 4/1
Australia (b)............................................ 13.1 14.2 (1.1) 18 19 (1)
__________
(a) Dealer-owned stocks represent our estimate of vehicles shipped to our customers (dealers) and not yet sold by the dealers to their retail customers, as well
as some vehicles reflected in our inventory.
(b) Includes only Ford and, in the United States, Lincoln and Mercury brands.
(c) European market share is based, in part, on estimated 2005 vehicle registrations for our 19 major European markets.
Overall Automotive Sector
The decline in results reflected losses at our Ford North America business unit, an impairment charge for long-lived assets of
Jaguar/Land Rover operations, and higher charges for personnel reduction programs, offset partially by more favorable market
performance at Land Rover and improved results of our Ford South America business unit, Other Automotive, and Ford Asia Pacific
and Africa/Mazda segment.
The table below details our 2005 cost performance (in billions):
Explanation of Cost Performance
2005 Costs*
Better/(Worse)
than 2004
Net product costs New product and commodities-related cost increases, offset partially by pricing reductions from
our suppliers and design cost reductions on existing products. ............................................................................. $ (1.0)
Pension and health care Primarily the effect of lower discount rates ........................................................................................................... (0.8)
Quality-related Warranty performance on prior model-year vehicles, offset partially by cost recoveries from suppliers
(including Bridgestone-Firestone North American Tire, LLC) ............................................................................. (0.4)
Depreciation and amortization Primarily related to investments for new vehicles and acceleration of depreciation in a number
of our operations..................................................................................................................................................... (0.3)
Overhead Primarily reductions in salaried personnel............................................................................................................. 0.3
Manufacturing and engineering Primarily hourly and salaried personnel reductions and ongoing
efficiencies in our plants......................................................................................................................................... 0.9
Total ................................................................................................................................................................... $ (1.3)
__________
* At constant volume, mix and exchange and excluding special items and discontinued operations.
The Americas Segment
Ford North America. The decline in results primarily reflected unfavorable cost performance, lower U.S. market share, lower
dealer stock levels, charges for personnel-reduction programs, and unfavorable currency exchange. Unfavorable cost performance
primarily reflected higher warranty and material costs.
Ford South America. The increase in earnings primarily reflected favorable net pricing in excess of higher commodity costs,
higher vehicle unit sales and favorable currency exchange.
Ford Motor Company Annual Report 2005 28 Ford Motor Company Annual Report 2005 29