Ford 2005 Annual Report Download - page 97
Download and view the complete annual report
Please find page 97 of the 2005 Ford annual report below. You can navigate through the pages in the report by either clicking on the pages listed below, or by using the keyword search tool below to find specific information within the annual report.-
 1
1 -
2
-
3
-
4
-
5
-
6
-
7
-
8
-
9
-
10
-
11
-
12
-
13
-
14
-
15
-
16
-
17
-
18
-
19
-
20
-
21
-
22
-
23
-
24
-
25
-
26
-
27
-
28
-
29
-
30
-
31
-
32
-
33
-
34
-
35
-
36
-
37
-
38
-
39
-
40
-
41
-
42
-
43
-
44
-
45
-
46
-
47
-
48
-
49
-
50
-
51
-
52
-
53
-
54
-
55
-
56
-
57
-
58
-
59
-
60
-
61
-
62
-
63
-
64
-
65
-
66
-
67
-
68
-
69
-
70
-
71
-
72
-
73
-
74
-
75
-
76
-
77
-
78
-
79
-
80
-
81
-
82
-
83
-
84
-
85
-
86
-
 87
87 -
 88
88 -
 89
89 -
 90
90 -
 91
91 -
 92
92 -
 93
93 -
 94
94 -
 95
95 -
 96
96 -
 97
97 -
 98
98 -
 99
99 -
 100
100 -
 101
101 -
 102
102 -
 103
103 -
 104
104 -
 105
105 -
 106
106 -
 107
107 -
108
 |
 |

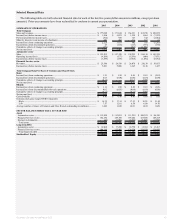
Ford Motor Company Annual Report 2005 94 Ford Motor Company Annual Report 2005 95
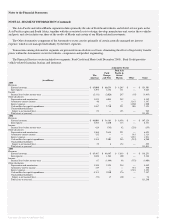
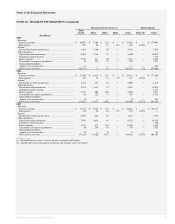
Notes to the Financial Statements
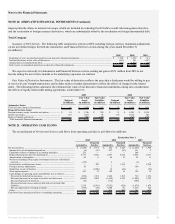
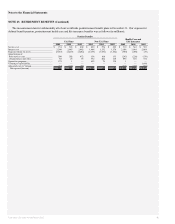
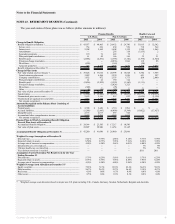
NOTE 24. SEGMENT INFORMATION (Continued)
Financial Services Sector (a) Total Company
Ford
Credit Hertz Other Elims Total Elims (b) Total
(in millions)
2005
Revenues
External customer................................................................
........
$ 16,047 $ 7,403 $ 136 $ — $ 23,586 $ — $ 177,089
Intersegment................................................................
................
597 20 55 (47) 625 (6,308) —
Income
Income/(loss) before income taxes ................................
..............
3,861 1,980 50 — 5,891 — 1,996
Other disclosures
Depreciation and amortization................................
.....................
4,507 1,316 37 — 5,860 — 14,042
Automotive interest income................................
.........................
1,187
Interest expense ................................................................
...........
5,842 511 70 — 6,423 — 7,643
Cash outflow for capital expenditures ................................
.........
48 335 11 — 394 — 7,517
Unconsolidated affiliates
Equity in net income/(loss)................................
........................
11 — — — 11 — 296
Total assets at year end................................
................................
162,155 — 39 — 162,194 (83) 275,940
2004
Revenues
External customer................................................................
........
$ 17,404 $ 6,681 $ 433 $ — $ 24,518 $ — $ 171,646
Intersegment................................................................
................
478 19 13 (13) 497 (6,828) —
Income
Income/(loss) before income taxes ................................
..............
4,431 493 84 — 5,008 — 4,853
Other disclosures
Depreciation and amortization................................
.....................
4,981 1,612 35 — 6,628 — 13,051
Automotive interest income................................
.........................
1,113
Interest expense ................................................................
...........
5,333 408 109 — 5,850 — 7,071
Cash outflow for capital expenditures ................................
.........
62 325 71 — 458 — 6,738
Unconsolidated affiliates
Equity in net income/(loss)................................
........................
(2) — — — (2) — 253
Total assets at year end................................
................................
172,621 14,417 2,062 — 189,100 (2,753) 299,398
2003
Revenues
External customer................................................................
........
$ 19,774 $ 5,926 $ 378 $ — $ 26,078 $ — $ 164,331
Intersegment................................................................
................
316 26 48 (51) 339 (5,655) —
Income
Income/(loss) before income taxes ................................
..............
2,956 228 63 — 3,247 — 1,339
Other disclosures
Depreciation and amortization................................
.....................
7,076 1,658 48 — 8,782 — 14,264
Automotive interest income................................
.........................
870
Interest expense ................................................................
...........
5,831 373 116 — 6,320 — 7,643
Cash outflow for capital expenditures ................................
.........
30 254 95 — 379 — 7,726
Unconsolidated affiliates
Equity in net income/(loss)................................
........................
12 — (3) — 9 — 83
Total assets at year end................................
................................
179,135 12,920 3,427 — 195,482 (3,356) 303,356
__________
(a) Financial Services sector’s interest income is recorded as Revenues.
(b) Includes intersector transactions occurring in the ordinary course of business.