NVIDIA 2013 Annual Report Download - page 186
Download and view the complete annual report
Please find page 186 of the 2013 NVIDIA annual report below. You can navigate through the pages in the report by either clicking on the pages listed below, or by using the keyword search tool below to find specific information within the annual report.-
 1
1 -
2
-
3
-
4
-
5
-
6
-
7
-
8
-
9
-
10
-
11
-
12
-
13
-
14
-
15
-
16
-
17
-
18
-
19
-
20
-
21
-
22
-
23
-
24
-
25
-
26
-
27
-
28
-
29
-
30
-
31
-
32
-
33
-
34
-
35
-
36
-
37
-
38
-
39
-
40
-
41
-
42
-
43
-
44
-
45
-
46
-
47
-
48
-
49
-
50
-
51
-
52
-
53
-
54
-
55
-
56
-
57
-
58
-
59
-
60
-
61
-
62
-
63
-
64
-
65
-
66
-
67
-
68
-
69
-
70
-
71
-
72
-
73
-
74
-
75
-
76
-
77
-
78
-
79
-
80
-
81
-
82
-
83
-
84
-
85
-
86
-
87
-
88
-
89
-
90
-
91
-
92
-
93
-
94
-
95
-
96
-
97
-
98
-
99
-
100
-
101
-
102
-
103
-
104
-
105
-
106
-
107
-
108
-
109
-
110
-
111
-
112
-
113
-
114
-
115
-
116
-
117
-
118
-
119
-
120
-
121
-
122
-
123
-
124
-
125
-
126
-
127
-
128
-
129
-
130
-
131
-
132
-
133
-
134
-
135
-
136
-
137
-
138
-
139
-
140
-
141
-
142
-
143
-
144
-
145
-
146
-
147
-
148
-
149
-
150
-
151
-
152
-
153
-
154
-
155
-
156
-
157
-
158
-
159
-
160
-
161
-
162
-
163
-
164
-
165
-
166
-
167
-
168
-
169
-
170
-
171
-
172
-
173
-
174
-
175
-
 176
176 -
 177
177 -
 178
178 -
 179
179 -
 180
180 -
 181
181 -
 182
182 -
 183
183 -
 184
184 -
 185
185 -
 186
186 -
 187
187 -
 188
188 -
 189
189 -
 190
190 -
 191
191 -
 192
192 -
 193
193 -
 194
194 -
 195
195 -
 196
196 -
197
-
198
-
199
-
200
-
201
-
202
-
203
-
204
-
205
-
206
-
207
-
208
-
209
-
210
-
211
-
212
-
213
-
214
-
215
-
216
-
217
-
218
-
219
-
220
-
221
-
222
-
223
-
224
-
225
-
226
-
227
-
228
-
229
-
230
-
231
-
232
-
233
-
234
-
235
-
236
-
237
-
238
-
239
-
240
-
241
-
242
-
243
-
244
-
245
-
246
-
247
-
248
-
249
-
250
-
251
-
252
-
253
-
254
-
255
-
256
-
257
-
258
-
259
-
260
-
261
-
262
-
263
-
264
 |
 |
42
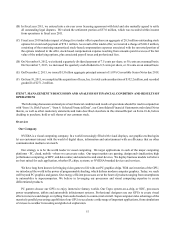
during fiscal years 2014 and 2013. As of January 26, 2014, our allowance for doubtful accounts receivable represented
0.2% of our gross accounts receivable balance.
Inventories
Inventory cost is computed on an adjusted standard basis, which approximates actual cost on an average or first-in,
first-out basis. Inventory costs consist primarily of the cost of semiconductors purchased from subcontractors, including
wafer fabrication, assembly, testing and packaging, manufacturing support costs, including labor and overhead associated
with such purchases, final test yield fallout, and shipping costs, as well as the cost of purchased memory products and other
component parts. We charge cost of sales for inventory provisions to write down our inventory to the lower of cost or
estimated market value or to completely write off obsolete or excess inventory. Most of our inventory provisions relate to
the write-off of excess quantities of products, based on our inventory levels and future product purchase commitments
compared to assumptions about future demand and market conditions. Once inventory has been written-off or written-down,
it creates a new cost basis for the inventory that is not subsequently written-up.
Situations that may result in excess or obsolete inventory include changes in business and economic conditions, changes
in consumer confidence caused by changes in market conditions, sudden and significant decreases in demand for our
products, inventory obsolescence because of rapidly changing technology and customer requirements, failure to estimate
customer demand properly for older products as newer products are introduced, or unexpected competitive pricing actions
by our competition. In addition, cancellation or deferral of customer purchase orders could result in our holding excess
inventory. Also, because we often sell a substantial portion of our products in the last month of each quarter, we may not
be able to reduce our inventory purchase commitments in a timely manner in response to customer cancellations or deferrals.
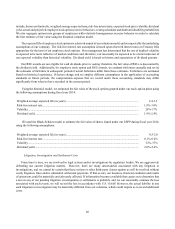
Charges to cost of sales for inventory provisions totaled $50.1 million, $89.9 million and $53.0 million, unfavorably
impacting our gross margin by 1.2%, 2.1% and 1.3%, in fiscal years 2014, 2013 and 2012, respectively. Sales of inventory
that was previously written-off or written-down totaled $43.4 million, $53.7 million and $71.1 million, favorably impacting
our gross margin by 1.1%, 1.3% and 1.8% in fiscal years 2014, 2013 and 2012, respectively. As a result, the overall net
effect on our gross margin from charges to cost of sales for inventory provisions and sales of items previously written-off
or written-down was a 0.1% unfavorable impact in fiscal year 2014, a 0.8% unfavorable impact in fiscal year 2013 and a
0.5% favorable impact in fiscal year 2012.
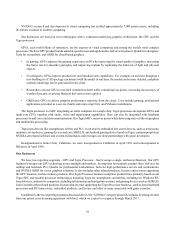
During fiscal years 2014, 2013 and 2012, the charges we took to cost of sales for inventory provisions were primarily
related to the write-off of excess quantities of certain older generations of GPU and Tegra Processor products whose inventory
levels were higher than our updated forecasts of future demand for those products. As a fabless semiconductor company,
we must make commitments to purchase inventory based on forecasts of future customer demand. In doing so, we must
account for our third-party manufacturers' lead times and constraints. We also adjust to other market factors, such as product
offerings and pricing actions by our competitors, new product transitions, and macroeconomic conditions - all of which
may impact demand for our products.
Please refer to the Gross Profit and Gross Margin discussion below in this Management's Discussion and Analysis for
further discussion.
Warranty Liabilities
Cost of revenue includes the estimated cost of product warranties that are calculated at the point of revenue recognition.
Under limited circumstances, we may offer an extended limited warranty to customers for certain products. Our products
are complex and may contain defects or experience failures due to any number of issues in design, fabrication, packaging,
materials and/or use within a system. If any of our products or technologies contains a defect, compatibility issue or other
error, we may have to invest additional research and development efforts to find and correct the issue. In addition, an error
or defect in new products or releases or related software drivers after commencement of commercial shipments could result
in failure to achieve market acceptance or loss of design wins. Also, we may be required to reimburse customers, including
our customers’ costs to repair or replace products in the field.