NVIDIA 2013 Annual Report Download - page 201
Download and view the complete annual report
Please find page 201 of the 2013 NVIDIA annual report below. You can navigate through the pages in the report by either clicking on the pages listed below, or by using the keyword search tool below to find specific information within the annual report.-
 1
1 -
2
-
3
-
4
-
5
-
6
-
7
-
8
-
9
-
10
-
11
-
12
-
13
-
14
-
15
-
16
-
17
-
18
-
19
-
20
-
21
-
22
-
23
-
24
-
25
-
26
-
27
-
28
-
29
-
30
-
31
-
32
-
33
-
34
-
35
-
36
-
37
-
38
-
39
-
40
-
41
-
42
-
43
-
44
-
45
-
46
-
47
-
48
-
49
-
50
-
51
-
52
-
53
-
54
-
55
-
56
-
57
-
58
-
59
-
60
-
61
-
62
-
63
-
64
-
65
-
66
-
67
-
68
-
69
-
70
-
71
-
72
-
73
-
74
-
75
-
76
-
77
-
78
-
79
-
80
-
81
-
82
-
83
-
84
-
85
-
86
-
87
-
88
-
89
-
90
-
91
-
92
-
93
-
94
-
95
-
96
-
97
-
98
-
99
-
100
-
101
-
102
-
103
-
104
-
105
-
106
-
107
-
108
-
109
-
110
-
111
-
112
-
113
-
114
-
115
-
116
-
117
-
118
-
119
-
120
-
121
-
122
-
123
-
124
-
125
-
126
-
127
-
128
-
129
-
130
-
131
-
132
-
133
-
134
-
135
-
136
-
137
-
138
-
139
-
140
-
141
-
142
-
143
-
144
-
145
-
146
-
147
-
148
-
149
-
150
-
151
-
152
-
153
-
154
-
155
-
156
-
157
-
158
-
159
-
160
-
161
-
162
-
163
-
164
-
165
-
166
-
167
-
168
-
169
-
170
-
171
-
172
-
173
-
174
-
175
-
176
-
177
-
178
-
179
-
180
-
181
-
182
-
183
-
184
-
185
-
186
-
187
-
188
-
189
-
190
-
 191
191 -
 192
192 -
 193
193 -
 194
194 -
 195
195 -
 196
196 -
 197
197 -
 198
198 -
 199
199 -
 200
200 -
 201
201 -
 202
202 -
 203
203 -
 204
204 -
 205
205 -
 206
206 -
 207
207 -
 208
208 -
 209
209 -
 210
210 -
 211
211 -
212
-
213
-
214
-
215
-
216
-
217
-
218
-
219
-
220
-
221
-
222
-
223
-
224
-
225
-
226
-
227
-
228
-
229
-
230
-
231
-
232
-
233
-
234
-
235
-
236
-
237
-
238
-
239
-
240
-
241
-
242
-
243
-
244
-
245
-
246
-
247
-
248
-
249
-
250
-
251
-
252
-
253
-
254
-
255
-
256
-
257
-
258
-
259
-
260
-
261
-
262
-
263
-
264
 |
 |
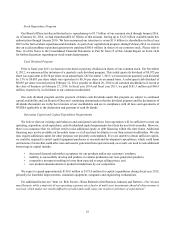
57
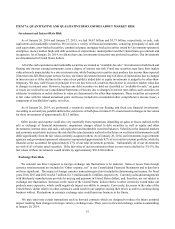
ITEM 7A. QUANTITATIVE AND QUALITATIVE DISCLOSURES ABOUT MARKET RISK
Investment and Interest Rate Risk
As of January 26, 2014 and January 27, 2013, we had $4.67 billion and $3.73 billion, respectively, in cash, cash
equivalents and marketable securities. We invest in a variety of financial instruments, consisting principally of cash and
cash equivalents, asset-backed securities, commercial paper, mortgage-backed securities issued by Government-sponsored
enterprises, money market funds and debt securities of corporations, municipalities and the United States government and
its agencies. As of January 26, 2014, we did not have any investments in auction-rate preferred securities. Our investments
are denominated in United States dollars.
All of the cash equivalents and marketable securities are treated as “available-for-sale.” Investments in both fixed and
floating rate interest earning instruments carry a degree of interest rate risk. Fixed rate securities may have their market
value adversely impacted due to a rise in interest rates, while floating rate securities may produce less income than expected
if interest rates fall. Due in part to these factors, our future investment income may fall short of expectations due to changes
in interest rates or if the decline in fair value of our publicly traded debt or equity investments is judged to be other-than-
temporary. We may suffer losses in principal if we are forced to sell securities that decline in securities market value due
to changes in interest rates. However, because any debt securities we hold are classified as “available-for-sale,” no gains
or losses are realized in our Consolidated Statements of Income due to changes in interest rates unless such securities are
sold prior to maturity or unless declines in value are determined to be other-than-temporary. These securities are reported
at fair value with the related unrealized gains and losses included in accumulated other comprehensive income (loss), a
component of stockholders’ equity, net of tax.
As of January 26, 2014, we performed a sensitivity analysis on our floating and fixed rate financial investments.
According to our analysis, parallel shifts in the yield curve of both plus or minus 0.5% would result in changes in fair values
for these investments of approximately $21.5 million.
Other income and expense could also vary materially from expectations depending on gains or losses realized on the
sale or exchange of financial instruments; impairment charges related to debt securities as well as equity and other
investments; interest rates; and cash, cash equivalent and marketable securities balances. Volatility in the financial markets
and economic uncertainty increases the risk that the actual amounts realized in the future on our financial instruments could
differ significantly from the fair values currently assigned to them. As of January 26, 2014, our investments in government
agencies and government sponsored enterprises represented approximately 42% of our total investment portfolio, while the
financial sector accounted for approximately 27% of our total investment portfolio. Substantially all of our investments
are with A/A3 or better rated securities. If the fair value of our investments in these sectors was to decline by 2%-5%, the
fair values of these investments would decline by approximately $56-$140 million.
Exchange Rate Risk
We consider our direct exposure to foreign exchange rate fluctuations to be minimal. Gains or losses from foreign
currency remeasurement are included in “Other expense, net” in our Consolidated Financial Statements and to date have
not been significant. The impact of foreign currency transaction gain (loss) included in determining net income for fiscal
years 2014, 2013 and 2012 was $4.7 million, $(1.5) million and $1.6 million, respectively. Currently, sales and arrangements
with third-party manufacturers provide for pricing and payment in United States dollars, and, therefore, are not subject to
exchange rate fluctuations. Increases in the value of the United States’ dollar relative to other currencies would make our
products more expensive, which could negatively impact our ability to compete. Conversely, decreases in the value of the
United States’ dollar relative to other currencies could result in our suppliers raising their prices in order to continue doing
business with us. Fluctuations in currency exchange rates could harm our business in the future.
We may enter into certain transactions such as forward contracts which are designed to reduce the future potential
impact resulting from changes in foreign currency exchange rates. There were no forward exchange contracts outstanding
at January 26, 2014.