NVIDIA 2013 Annual Report Download - page 197
Download and view the complete annual report
Please find page 197 of the 2013 NVIDIA annual report below. You can navigate through the pages in the report by either clicking on the pages listed below, or by using the keyword search tool below to find specific information within the annual report.-
 1
1 -
2
-
3
-
4
-
5
-
6
-
7
-
8
-
9
-
10
-
11
-
12
-
13
-
14
-
15
-
16
-
17
-
18
-
19
-
20
-
21
-
22
-
23
-
24
-
25
-
26
-
27
-
28
-
29
-
30
-
31
-
32
-
33
-
34
-
35
-
36
-
37
-
38
-
39
-
40
-
41
-
42
-
43
-
44
-
45
-
46
-
47
-
48
-
49
-
50
-
51
-
52
-
53
-
54
-
55
-
56
-
57
-
58
-
59
-
60
-
61
-
62
-
63
-
64
-
65
-
66
-
67
-
68
-
69
-
70
-
71
-
72
-
73
-
74
-
75
-
76
-
77
-
78
-
79
-
80
-
81
-
82
-
83
-
84
-
85
-
86
-
87
-
88
-
89
-
90
-
91
-
92
-
93
-
94
-
95
-
96
-
97
-
98
-
99
-
100
-
101
-
102
-
103
-
104
-
105
-
106
-
107
-
108
-
109
-
110
-
111
-
112
-
113
-
114
-
115
-
116
-
117
-
118
-
119
-
120
-
121
-
122
-
123
-
124
-
125
-
126
-
127
-
128
-
129
-
130
-
131
-
132
-
133
-
134
-
135
-
136
-
137
-
138
-
139
-
140
-
141
-
142
-
143
-
144
-
145
-
146
-
147
-
148
-
149
-
150
-
151
-
152
-
153
-
154
-
155
-
156
-
157
-
158
-
159
-
160
-
161
-
162
-
163
-
164
-
165
-
166
-
167
-
168
-
169
-
170
-
171
-
172
-
173
-
174
-
175
-
176
-
177
-
178
-
179
-
180
-
181
-
182
-
183
-
184
-
185
-
186
-
 187
187 -
 188
188 -
 189
189 -
 190
190 -
 191
191 -
 192
192 -
 193
193 -
 194
194 -
 195
195 -
 196
196 -
 197
197 -
 198
198 -
 199
199 -
 200
200 -
 201
201 -
 202
202 -
 203
203 -
 204
204 -
 205
205 -
 206
206 -
 207
207 -
208
-
209
-
210
-
211
-
212
-
213
-
214
-
215
-
216
-
217
-
218
-
219
-
220
-
221
-
222
-
223
-
224
-
225
-
226
-
227
-
228
-
229
-
230
-
231
-
232
-
233
-
234
-
235
-
236
-
237
-
238
-
239
-
240
-
241
-
242
-
243
-
244
-
245
-
246
-
247
-
248
-
249
-
250
-
251
-
252
-
253
-
254
-
255
-
256
-
257
-
258
-
259
-
260
-
261
-
262
-
263
-
264
 |
 |
53
Cash used in investing activities for fiscal year 2014 increased from fiscal year 2013 driven primarily by capital
expenditures in fiscal year 2014 for new technology licenses and leasehold improvements at our facilities in various locations.
Cash used in investing activities for fiscal year 2013 decreased from fiscal year 2012 due primarily to the acquisition
of Icera in fiscal year 2012. We used $183.3 million towards capital expenditures in fiscal year 2013 mainly for the purchase
of new research and development equipment, testing equipment to support our increased production requirements,
technology licenses, software, intangible assets and leasehold improvements at our facilities in various locations.
Financing activities
Financing activities consist primarily of borrowing activities, such as convertible debt issuances or capital leases, and
equity-related activities such as stock repurchases and dividend payments.
Cash provided by financing activities increased in fiscal year 2014 due primarily to the net proceeds of $1.48 billion
we received from the convertible note offering that was completed during the fourth quarter of fiscal year 2014 as well as
cash proceeds of $70.2 million from common stock issued under our employee stock plans. Concurrent with the convertible
note offering, we used net proceeds of $108 million to fund the related note hedge and warrant transactions. During fiscal
year 2014, we also used $887.3 million to repurchase shares of our common stock and paid $181.3 million of cash dividends
to shareholders.
Cash used in financing activities in fiscal year 2013 was due primarily to our repurchase of $100.0 million of shares
of our common stock and our first quarterly cash dividend payment of $46.9 million. These uses of cash were offset by
cash proceeds of $64.9 million from common stock issued under our employee stock plans and a non-cash tax benefit of
$68.7 million related to employee stock-based compensation.
Liquidity
Our primary source of liquidity is cash generated by our operations. Our investment portfolio consisted of cash and
cash equivalents, commercial paper, mortgage-backed securities issued by government-sponsored enterprises, money market
funds and debt securities of corporations, municipalities and the United States government and its agencies. These
investments are denominated in United States dollars. As of January 26, 2014, we did not have any investments in auction-
rate preferred securities.
All of the cash equivalents and marketable securities are treated as “available-for-sale”. Investments in both fixed and
floating rate interest earning instruments carry a degree of interest rate risk. Fixed rate debt securities may have their market
value adversely impacted due to a rise in interest rates, while floating rate securities may produce less income than expected
if interest rates fall. Due in part to these factors, our future investment income may fall short of expectations due to changes
in interest rates or if the decline in fair value of our publicly traded debt or equity investments is judged to be other-than-
temporary. We may suffer losses in principal if we are forced to sell securities that decline in market value due to changes
in interest rates. However, because any debt securities we hold are classified as “available-for-sale,” no gains or losses are
realized in our statement of income due to changes in interest rates unless such securities are sold prior to maturity or unless
declines in market values are determined to be other-than-temporary. These securities are reported at fair value with the
related unrealized gains and losses included in accumulated other comprehensive income, a component of stockholders’
equity, net of tax.
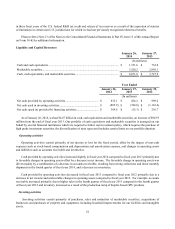
As of January 26, 2014 and January 27, 2013, we had $4.67 billion and $3.73 billion, respectively, in cash, cash
equivalents and marketable securities. Our investment policy requires the purchase of high grade investment securities,
the diversification of asset types and includes certain limits on our portfolio duration, as specified in our investment policy
guidelines. These guidelines also limit the amount of credit exposure to any one issue, issuer or type of instrument. As of
January 26, 2014, we were in compliance with our investment policy. As of January 26, 2014, our investments in U.S.
government agencies and U.S. government sponsored enterprises represented approximately 42% of our total investment