NVIDIA 2013 Annual Report Download - page 51
Download and view the complete annual report
Please find page 51 of the 2013 NVIDIA annual report below. You can navigate through the pages in the report by either clicking on the pages listed below, or by using the keyword search tool below to find specific information within the annual report.-
 1
1 -
2
-
3
-
4
-
5
-
6
-
7
-
8
-
9
-
10
-
11
-
12
-
13
-
14
-
15
-
16
-
17
-
18
-
19
-
20
-
21
-
22
-
23
-
24
-
25
-
26
-
27
-
28
-
29
-
30
-
31
-
32
-
33
-
34
-
35
-
36
-
37
-
38
-
39
-
40
-
 41
41 -
 42
42 -
 43
43 -
 44
44 -
 45
45 -
 46
46 -
 47
47 -
 48
48 -
 49
49 -
 50
50 -
 51
51 -
 52
52 -
 53
53 -
 54
54 -
 55
55 -
 56
56 -
 57
57 -
 58
58 -
 59
59 -
 60
60 -
 61
61 -
62
-
63
-
64
-
65
-
66
-
67
-
68
-
69
-
70
-
71
-
72
-
73
-
74
-
75
-
76
-
77
-
78
-
79
-
80
-
81
-
82
-
83
-
84
-
85
-
86
-
87
-
88
-
89
-
90
-
91
-
92
-
93
-
94
-
95
-
96
-
97
-
98
-
99
-
100
-
101
-
102
-
103
-
104
-
105
-
106
-
107
-
108
-
109
-
110
-
111
-
112
-
113
-
114
-
115
-
116
-
117
-
118
-
119
-
120
-
121
-
122
-
123
-
124
-
125
-
126
-
127
-
128
-
129
-
130
-
131
-
132
-
133
-
134
-
135
-
136
-
137
-
138
-
139
-
140
-
141
-
142
-
143
-
144
-
145
-
146
-
147
-
148
-
149
-
150
-
151
-
152
-
153
-
154
-
155
-
156
-
157
-
158
-
159
-
160
-
161
-
162
-
163
-
164
-
165
-
166
-
167
-
168
-
169
-
170
-
171
-
172
-
173
-
174
-
175
-
176
-
177
-
178
-
179
-
180
-
181
-
182
-
183
-
184
-
185
-
186
-
187
-
188
-
189
-
190
-
191
-
192
-
193
-
194
-
195
-
196
-
197
-
198
-
199
-
200
-
201
-
202
-
203
-
204
-
205
-
206
-
207
-
208
-
209
-
210
-
211
-
212
-
213
-
214
-
215
-
216
-
217
-
218
-
219
-
220
-
221
-
222
-
223
-
224
-
225
-
226
-
227
-
228
-
229
-
230
-
231
-
232
-
233
-
234
-
235
-
236
-
237
-
238
-
239
-
240
-
241
-
242
-
243
-
244
-
245
-
246
-
247
-
248
-
249
-
250
-
251
-
252
-
253
-
254
-
255
-
256
-
257
-
258
-
259
-
260
-
261
-
262
-
263
-
264
 |
 |
33
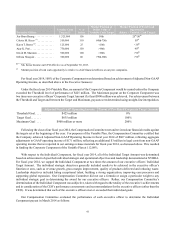
For fiscal year 2014, the Compensation Committee selected GAAP operating income adjusted for certain pre-determined
costs and/or credits as the financial performance target under the Variable Plan and PSUs. The Compensation Committee
selected this metric because it believes this to be a key indicator of our overall financial performance. Specifically, the
Compensation Committee determined that management’s achievement of this metric should be based on GAAP operating
income excluding stock-based compensation, acquisition-related costs, certain legal costs and other expenses. We refer to
this metric as Adjusted Non-GAAP Operating Income. The net aggregate adjustment to GAAP operating income for these
items for fiscal year 2014 was $171 million, reflecting an additional $3 million in legal costs from non-GAAP operating
income that we reported in our earnings release materials for fiscal year 2014.
Based on the operating plan prepared for fiscal year 2014 as approved by the Board, the Compensation Committee set
a goal of $635 million in Adjusted Non-GAAP Operating Income to achieve Target-level awards (with a Threshold level
of $425 million and a Maximum level of $900 million). The Target goal of $635 million incorporated investments in our
future growth businesses and a probable range of revenue that took into account both macroeconomic conditions and
reasonable estimates for new businesses. The Compensation Committee determined that for fiscal year 2014 a Target
Adjusted Non-GAAP Operating Income of $635 million was attainable with significant effort and success in execution, but
was not certain. In addition, the Compensation Committee believed that for fiscal year 2014 achievement of a Maximum
Adjusted Non-GAAP Operating Income of $900 million was only possible with strong market factors and a very high level
of successful execution and performance by our management. For Mr. Huang’s PSUs, the Target goal of $635 million
needed to be achieved for any portion of the grant to vest.
Following the close of our fiscal year 2014, the Compensation Committee met and reviewed our financial results against
the targets set at the beginning of the year. Our financial and performance results for fiscal year 2014 are discussed in the
Proxy Summary preceding this proxy statement. For purposes of the Variable Plan and the PSUs, the Compensation
Committee certified that the Company achieved Adjusted Non-GAAP Operating Income in fiscal year 2014 of $667 million,
reflecting aggregate adjustments to GAAP operating income of $171 million as discussed above. This resulted in funding
the corporate financial award component of the Variable Plan at 112.08%, and 108.05% of Mr. Huang’s Target PSUs
becoming eligible to vest over a four year period beginning on the date of grant (with 25% vesting on approximately the
one year anniversary of the date of grant), each as more fully described below.
Executive Compensation Philosophy and Overview
The primary goal for our executive compensation program is to attract, motivate and retain a talented, innovative and
entrepreneurial team of executives to provide leadership for our success in a dynamic, competitive market. We seek to
accomplish this goal in ways that align with our business objectives, our performance and the long-term interests of our
stockholders. We design our executive compensation program to position NVIDIA competitively among the companies
against which we recruit and compete for talent. We also consider the financial obligations created by our executive
compensation program, as well as the equity expense and the potential dilution of stockholder ownership.
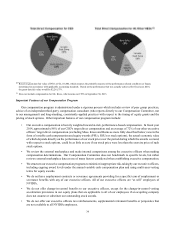
As in recent years, the principal components of our executive compensation program for fiscal year 2014 consisted of
base salaries, variable cash compensation and equity compensation. Our Compensation Committee does not use a strict
weighting system among compensation elements for each executive officer, but instead considers the total compensation
necessary to attract, motivate and retain these individuals with a mix that includes a higher percentage of performance-
based components, including variable cash compensation and equity compensation, in positions of higher responsibility.
Our Compensation Committee believes that a mix of both cash and equity incentives is appropriate, as cash incentives
reward executives for near-term results, while equity incentives motivate executives to increase and sustain stockholder
value in the longer term. For fiscal year 2014, the pay mix for our executive officers is reflected in the charts below.