NVIDIA 2013 Annual Report Download - page 59
Download and view the complete annual report
Please find page 59 of the 2013 NVIDIA annual report below. You can navigate through the pages in the report by either clicking on the pages listed below, or by using the keyword search tool below to find specific information within the annual report.-
 1
1 -
2
-
3
-
4
-
5
-
6
-
7
-
8
-
9
-
10
-
11
-
12
-
13
-
14
-
15
-
16
-
17
-
18
-
19
-
20
-
21
-
22
-
23
-
24
-
25
-
26
-
27
-
28
-
29
-
30
-
31
-
32
-
33
-
34
-
35
-
36
-
37
-
38
-
39
-
40
-
41
-
42
-
43
-
44
-
45
-
46
-
47
-
48
-
 49
49 -
 50
50 -
 51
51 -
 52
52 -
 53
53 -
 54
54 -
 55
55 -
 56
56 -
 57
57 -
 58
58 -
 59
59 -
 60
60 -
 61
61 -
 62
62 -
 63
63 -
 64
64 -
 65
65 -
 66
66 -
 67
67 -
 68
68 -
 69
69 -
70
-
71
-
72
-
73
-
74
-
75
-
76
-
77
-
78
-
79
-
80
-
81
-
82
-
83
-
84
-
85
-
86
-
87
-
88
-
89
-
90
-
91
-
92
-
93
-
94
-
95
-
96
-
97
-
98
-
99
-
100
-
101
-
102
-
103
-
104
-
105
-
106
-
107
-
108
-
109
-
110
-
111
-
112
-
113
-
114
-
115
-
116
-
117
-
118
-
119
-
120
-
121
-
122
-
123
-
124
-
125
-
126
-
127
-
128
-
129
-
130
-
131
-
132
-
133
-
134
-
135
-
136
-
137
-
138
-
139
-
140
-
141
-
142
-
143
-
144
-
145
-
146
-
147
-
148
-
149
-
150
-
151
-
152
-
153
-
154
-
155
-
156
-
157
-
158
-
159
-
160
-
161
-
162
-
163
-
164
-
165
-
166
-
167
-
168
-
169
-
170
-
171
-
172
-
173
-
174
-
175
-
176
-
177
-
178
-
179
-
180
-
181
-
182
-
183
-
184
-
185
-
186
-
187
-
188
-
189
-
190
-
191
-
192
-
193
-
194
-
195
-
196
-
197
-
198
-
199
-
200
-
201
-
202
-
203
-
204
-
205
-
206
-
207
-
208
-
209
-
210
-
211
-
212
-
213
-
214
-
215
-
216
-
217
-
218
-
219
-
220
-
221
-
222
-
223
-
224
-
225
-
226
-
227
-
228
-
229
-
230
-
231
-
232
-
233
-
234
-
235
-
236
-
237
-
238
-
239
-
240
-
241
-
242
-
243
-
244
-
245
-
246
-
247
-
248
-
249
-
250
-
251
-
252
-
253
-
254
-
255
-
256
-
257
-
258
-
259
-
260
-
261
-
262
-
263
-
264
 |
 |

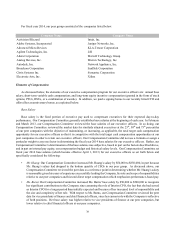
41
Executive Officer
Variable Cash
Target ($)
% of
Salary
Market Position of
Dollar Value of
Variable Cash Target
Market Position of Total Cash
Opportunity
(Salary + Variable Cash Target)
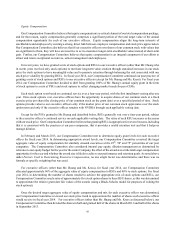
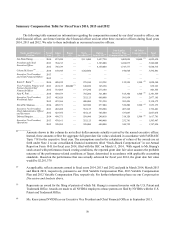
Jen-Hsun Huang . . . . . . . . . . . . . . 1,325,000 156 50th 25th-50th
Colette M. Kress (1) . . . . . . . . . . . . 550,000 110 60th-75th 50th
Karen T. Burns (2). . . . . . . . . . . . . . 125,000 25 <10th <10th
Ajay K. Puri
. . . . . . . . . . . . . . . . . . 750,000 150 >90th 90th
David M. Shannon
. . . . . . . . . . . . . 500,000 100 >90th >90th
Debora Shoquist . . . . . . . . . . . . . . 300,000 60 75th-90th >90th
__________
(1) Ms. Kress became our CFO effective as of September 30, 2013.
(2) Market position of total cash opportunity is relative to chief financial officers at our peer companies.
For fiscal year 2014, 100% of the Corporate Component was determined based on achievement of Adjusted Non-GAAP
Operating Income, as described above in the Executive Summary.
Under the fiscal year 2014 Variable Plan, no amount of the Corporate Component would be earned unless the Company
exceeded the Threshold level of performance of $425 million. The Maximum payout on the Corporate Component was
two times our executive officers’ Corporate Target Amount if at least $900 million was achieved. For achievement between
the Threshold and Target and between the Target and Maximum, payouts were determined using straight-line interpolation.
Adjusted Non-GAAP Operating Income Payout of Pro-Rated Corporate Target Amount
Threshold Goal. . . . $425 million 0%
Target Goal. . . . . . . $635 million 100%
Maximum Goal . . . $900 million or more 200%
Following the close of our fiscal year 2014, the Compensation Committee met and reviewed our financial results against
the targets set at the beginning of the year. For purposes of the Variable Plan, the Compensation Committee certified that
the Company achieved Adjusted Non-GAAP Operating Income in fiscal year 2014 of $667 million, reflecting aggregate
adjustments to GAAP operating income of $171 million, reflecting an additional $3 million in legal costs from non-GAAP
operating income that we reported in our earnings release materials for fiscal year 2014, as discussed above. This resulted
in funding the Corporate Component of the Variable Plan at 112.08%.
With respect to the Individual Component, for fiscal year 2014, all of the Individual Target Amount was determined
based on achievement of specified individual strategic and operational objectives and leadership demonstrated at NVIDIA.
For fiscal year 2014, we capped the Individual Component at two times the amount of our executive officers’ Individual
Target Amount. The individual strategic objectives generally included results to be achieved in the executive officer’s
function or area, such as revenue growth, gross margin improvement, quality of products delivered and reducing waste.
Leadership objectives included hiring exceptional talent, building a strong organization, improving core processes and
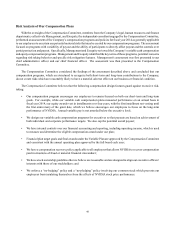
supporting global expansion. Our Compensation Committee did not use a formula or assign a particular weight to any
individual strategic goal in determining the award for our executive officers. Rather, our Compensation Committee’s
determination of the Individual Component was subjective, taken with regard to the totality of the executive’s achievements
and in consideration of the CEO’s performance assessments and recommendations for the executive officers (other than the
CEO). It was determined that each of the executive officers met or exceeded their individual goals.
Our Compensation Committee evaluated the performance of each executive officer to determine the Individual
Component payout in March 2014 as follows: