NVIDIA 2013 Annual Report Download - page 210
Download and view the complete annual report
Please find page 210 of the 2013 NVIDIA annual report below. You can navigate through the pages in the report by either clicking on the pages listed below, or by using the keyword search tool below to find specific information within the annual report.-
 1
1 -
2
-
3
-
4
-
5
-
6
-
7
-
8
-
9
-
10
-
11
-
12
-
13
-
14
-
15
-
16
-
17
-
18
-
19
-
20
-
21
-
22
-
23
-
24
-
25
-
26
-
27
-
28
-
29
-
30
-
31
-
32
-
33
-
34
-
35
-
36
-
37
-
38
-
39
-
40
-
41
-
42
-
43
-
44
-
45
-
46
-
47
-
48
-
49
-
50
-
51
-
52
-
53
-
54
-
55
-
56
-
57
-
58
-
59
-
60
-
61
-
62
-
63
-
64
-
65
-
66
-
67
-
68
-
69
-
70
-
71
-
72
-
73
-
74
-
75
-
76
-
77
-
78
-
79
-
80
-
81
-
82
-
83
-
84
-
85
-
86
-
87
-
88
-
89
-
90
-
91
-
92
-
93
-
94
-
95
-
96
-
97
-
98
-
99
-
100
-
101
-
102
-
103
-
104
-
105
-
106
-
107
-
108
-
109
-
110
-
111
-
112
-
113
-
114
-
115
-
116
-
117
-
118
-
119
-
120
-
121
-
122
-
123
-
124
-
125
-
126
-
127
-
128
-
129
-
130
-
131
-
132
-
133
-
134
-
135
-
136
-
137
-
138
-
139
-
140
-
141
-
142
-
143
-
144
-
145
-
146
-
147
-
148
-
149
-
150
-
151
-
152
-
153
-
154
-
155
-
156
-
157
-
158
-
159
-
160
-
161
-
162
-
163
-
164
-
165
-
166
-
167
-
168
-
169
-
170
-
171
-
172
-
173
-
174
-
175
-
176
-
177
-
178
-
179
-
180
-
181
-
182
-
183
-
184
-
185
-
186
-
187
-
188
-
189
-
190
-
191
-
192
-
193
-
194
-
195
-
196
-
197
-
198
-
199
-
 200
200 -
 201
201 -
 202
202 -
 203
203 -
 204
204 -
 205
205 -
 206
206 -
 207
207 -
 208
208 -
 209
209 -
 210
210 -
 211
211 -
 212
212 -
 213
213 -
 214
214 -
 215
215 -
 216
216 -
 217
217 -
 218
218 -
 219
219 -
 220
220 -
221
-
222
-
223
-
224
-
225
-
226
-
227
-
228
-
229
-
230
-
231
-
232
-
233
-
234
-
235
-
236
-
237
-
238
-
239
-
240
-
241
-
242
-
243
-
244
-
245
-
246
-
247
-
248
-
249
-
250
-
251
-
252
-
253
-
254
-
255
-
256
-
257
-
258
-
259
-
260
-
261
-
262
-
263
-
264
 |
 |

66
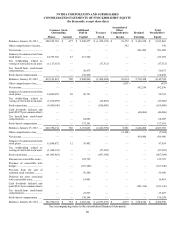
NVIDIA CORPORATION AND SUBSIDIARIES
CONSOLIDATED STATEMENTS OF STOCKHOLDERS’ EQUITY
(In thousands, except share data)
Common Stock
Outstanding Additional
Paid-in Treasury
Accumulated
Other
Comprehensive Retained Total
Stockholders'
Shares Amount Capital Stock Income Earnings Equity
Balances, January 30, 2011 ...... 588,555,701 $ 677 $ 2,500,577 $ (1,479,392) $ 10,272 $ 2,149,328 $ 3,181,462
Other comprehensive income... — — — — 342 — 342
Net income................................ — — — — 581,090 581,090
Issuance of common stock from
stock plans ................................ 24,753,362 23 213,346 — — — 213,369
Tax withholding related to
vesting of restricted stock units (1,117,651) — — (17,512) — — (17,512)
Tax benefit from stock-based
compensation
............................ — — 50,475 — — — 50,475
Stock-based compensation ....... — — 136,498 — — — 136,498
Balances, January 29, 2012 ...... 612,191,412 700 2,900,896 (1,496,904) 10,614 2,730,418 4,145,724
Other comprehensive loss......... — — — — (633) — (633)
Net income................................ — — — — 562,536 562,536
Issuance of common stock from
stock plans ................................ 14,800,959 20 90,721 — — — 90,741
Tax withholding related to
vesting of restricted stock units (1,836,097) — — (25,805) — — (25,805)
Stock repurchase....................... (8,400,140) — — (100,000) — — (100,000)
Cash dividends declared and
paid ($0.075 per common share) — — — — — (46,866) (46,866)
Tax benefit from stock-based
compensation
............................ — — 64,905 — — — 64,905
Stock-based compensation ....... — — 137,101 — — — 137,101
Balances, January 27, 2013 ...... 616,756,134 720 3,193,623 (1,622,709) 9,981 3,246,088 4,827,703
Other comprehensive loss......... — — — — (5,104) — (5,104)
Net income................................ — — — — — 439,990 439,990
Issuance of common stock from
stock plans ................................ 15,088,872 12 97,442 — — — 97,454
Tax withholding related to
vesting of restricted stock units (1,944,391) — — (27,282) — — (27,282)
Stock repurchase....................... (61,903,881) — — (887,304) — (887,304)
Discount on convertible notes .. — — 125,725 — — — 125,725
Purchase of convertible note
hedges....................................... — — (167,100) — — — (167,100)
Proceeds from the sale of
common stock warrants............ — — 59,100 — — — 59,100
Deferred tax asset associated
with convertible notes............... — — 14,481 — — — 14,481
Cash dividends declared and
paid ($0.310 per common share) — — — — — (181,336) (181,336)
Tax benefit from stock-based
compensation
............................ — — 23,827 — — — 23,827
Stock-based compensation ....... — — 136,244 — — — 136,244
Balances, January 26, 2014 ...... 567,996,734 $ 732 $ 3,483,342 $ (2,537,295) $ 4,877 $ 3,504,742 $ 4,456,398
See accompanying notes to the consolidated financial statements.