Unum 2007 Annual Report Download - page 107
Download and view the complete annual report
Please find page 107 of the 2007 Unum annual report below. You can navigate through the pages in the report by either clicking on the pages listed below, or by using the keyword search tool below to find specific information within the annual report.-
 1
1 -
2
-
3
-
4
-
5
-
6
-
7
-
8
-
9
-
10
-
11
-
12
-
13
-
14
-
15
-
16
-
17
-
18
-
19
-
20
-
21
-
22
-
23
-
24
-
25
-
26
-
27
-
28
-
29
-
30
-
31
-
32
-
33
-
34
-
35
-
36
-
37
-
38
-
39
-
40
-
41
-
42
-
43
-
44
-
45
-
46
-
47
-
48
-
49
-
50
-
51
-
52
-
53
-
54
-
55
-
56
-
57
-
58
-
59
-
60
-
61
-
62
-
63
-
64
-
65
-
66
-
67
-
68
-
69
-
70
-
71
-
72
-
73
-
74
-
75
-
76
-
77
-
78
-
79
-
80
-
81
-
82
-
83
-
84
-
85
-
86
-
87
-
88
-
89
-
90
-
91
-
92
-
93
-
94
-
95
-
96
-
 97
97 -
 98
98 -
 99
99 -
 100
100 -
 101
101 -
 102
102 -
 103
103 -
 104
104 -
 105
105 -
 106
106 -
 107
107 -
 108
108 -
 109
109 -
 110
110 -
 111
111 -
 112
112 -
 113
113 -
 114
114 -
 115
115 -
 116
116 -
 117
117 -
118
-
119
-
120
-
121
-
122
-
123
-
124
-
125
-
126
-
127
-
128
-
129
-
130
-
131
-
132
-
133
-
134
-
135
-
136
-
137
-
138
-
139
-
140
-
141
-
142
-
143
-
144
-
145
-
146
-
147
-
148
 |
 |

Unum 2007 Annual Report 105
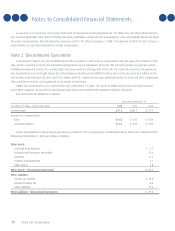
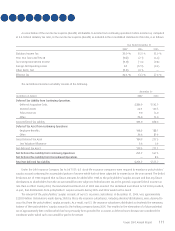
Investment Valuation Allowances
At December 31, 2007 and 2006, we had real estate investment allowances totaling $7.6 million. We had no changes to the
allowance during 2007 and 2006. Deductions for allowances released upon disposal or restructuring totaled $1.7 million in 2005.
We had no valuation allowance for mortgage loans at December 31, 2007. The balance in the valuation allowance for mortgage
loans was $0.5 million at December 31, 2006. Increases (decreases) to the allowance during 2007 and 2006 were $(0.5) million and
$0.5 million, respectively. There were no changes during 2005.
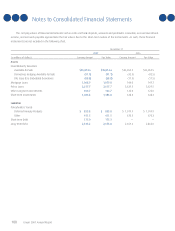
Net Investment Income
Sources for net investment income are as follows:
Year Ended December 31
(in millions of dollars) 2007 2006 2005
Fixed Maturity Securities $ 2,315.2 $ 2,262.0 $ 2,151.3
Mortgage Loans 64.3 54.6 43.0
Real Estate 0.5 1.0 0.4
Policy Loans 12.7 12.6 17.4
Other Long-term Investments 6.8 8.4 8.5
Short-term Investments 49.5 21.0 10.8
Gross Investment Income 2,449.0 2,359.6 2,231.4
Less Investment Expenses 17.0 21.0 19.9
Less Investment Income on PFA Assets 22.1 18.0 23.2
Net Investment Income $ 2,409.9 $ 2,320.6 $ 2,188.3
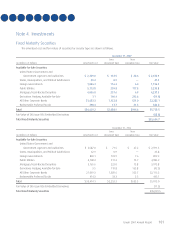
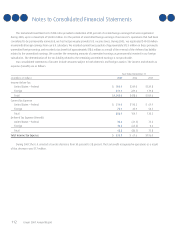
Realized Investment Gain and Loss
Realized investment gains (losses) are as follows:
Year Ended December 31
(in millions of dollars) 2007 2006 2005
Fixed Maturity Securities
Gross Gains $ 56.0 $ 68.3 $ 74.4
Gross Losses (82.8) (71.1) (95.7)
Mortgage Loans, Real Estate, and Other Invested Assets 19.0 10.3 22.8
Change in Fair Value of DIG Issue B36 Derivatives (57.3) (5.3) (7.9)
Other Derivatives (0.1) — (0.3)
Realized Investment Gain (Loss) $ (65.2) $ 2.2 $ (6.7)