Unum 2007 Annual Report Download - page 122
Download and view the complete annual report
Please find page 122 of the 2007 Unum annual report below. You can navigate through the pages in the report by either clicking on the pages listed below, or by using the keyword search tool below to find specific information within the annual report.-
 1
1 -
2
-
3
-
4
-
5
-
6
-
7
-
8
-
9
-
10
-
11
-
12
-
13
-
14
-
15
-
16
-
17
-
18
-
19
-
20
-
21
-
22
-
23
-
24
-
25
-
26
-
27
-
28
-
29
-
30
-
31
-
32
-
33
-
34
-
35
-
36
-
37
-
38
-
39
-
40
-
41
-
42
-
43
-
44
-
45
-
46
-
47
-
48
-
49
-
50
-
51
-
52
-
53
-
54
-
55
-
56
-
57
-
58
-
59
-
60
-
61
-
62
-
63
-
64
-
65
-
66
-
67
-
68
-
69
-
70
-
71
-
72
-
73
-
74
-
75
-
76
-
77
-
78
-
79
-
80
-
81
-
82
-
83
-
84
-
85
-
86
-
87
-
88
-
89
-
90
-
91
-
92
-
93
-
94
-
95
-
96
-
97
-
98
-
99
-
100
-
101
-
102
-
103
-
104
-
105
-
106
-
107
-
108
-
109
-
110
-
111
-
 112
112 -
 113
113 -
 114
114 -
 115
115 -
 116
116 -
 117
117 -
 118
118 -
 119
119 -
 120
120 -
 121
121 -
 122
122 -
 123
123 -
 124
124 -
 125
125 -
 126
126 -
 127
127 -
 128
128 -
 129
129 -
 130
130 -
 131
131 -
 132
132 -
133
-
134
-
135
-
136
-
137
-
138
-
139
-
140
-
141
-
142
-
143
-
144
-
145
-
146
-
147
-
148
 |
 |

Notes to Consolidated Financial Statements
120 Unum 2007 Annual Report
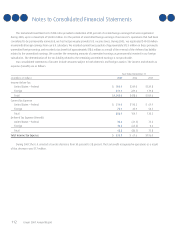
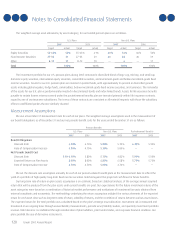
The weighted average asset allocations, by asset category, for our funded pension plans are as follows:
U.S. Plans Non U.S. Plans
2007 2006 2007 2006
Target Actual Target Actual Target Actual Target Actual
Equity Securities 55–65% 58% 55–65% 61% 60% 56% 60% 50%
Fixed Income Securities 27–33 31 27–33 29 40 38 40 39
Other 8–12 11 8–12 10 — 6 — 11
Total 100% 100% 100% 100%
The investment portfolio for our U.S. pension plans during 2007 contained a diversified blend of large cap, mid cap, and small cap
domestic equity securities, international equity securities, convertible securities, and investment-grade and below-investment-grade fixed
income securities. Assets for our U.K. pension plan are invested in pooled funds, with approximately 56 percent in diversified growth
assets including global equities, hedge funds, commodities, below-investment-grade fixed income securities, and currencies. The remainder
of the assets for our U.K. plan is predominantly invested in fixed interest bonds and index linked bonds. Assets for life insurance benefits
payable to certain former retirees covered under the postretirement benefits plan are invested primarily within life insurance contracts
issued by one of our insurance subsidiaries. The terms of these contracts are consistent in all material respects with those the subsidiary
offers to unaffiliated parties that are similarly situated.
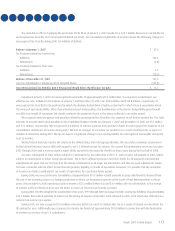
Measurement Assumptions
We use a December 31 measurement date for each of our plans. The weighted average assumptions used in the measurement of
our benefit obligations as of December 31 and our net periodic benefit costs for the years ended December 31 are as follows:
Pension Benefits
U.S. Plans Non U.S. Plans Postretirement Benefits
2007 2006 2007 2006 2007 2006
Benefit Obligations
Discount Rate 6.50% 6.10% 5.80% 5.10% 6.30% 5.90%
Rate of Compensation Increase 4.70% 4.70% 5.30% 5.00% — —
Net Periodic Benefit Cost
Discount Rate 5.90–6.10% 5.80% 5.10% 4.82% 5.90% 5.50%
Expected Return on Plan Assets 8.00% 8.00% 6.80% 6.58% 5.75% 5.75%
Rate of Compensation Increase 4.70% 4.70% 5.00% 4.70% — —
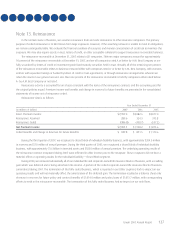
We set the discount rate assumption annually for each of our pension-related benefit plans at the measurement date to reflect the
yield of a portfolio of high quality long-term fixed income securities matched against the projected cash flows for future benefits.
Our long-term rate of return on plan assets assumption is an estimate, based on statistical analysis, of the average annual assumed
return that will be produced from the plan assets until current benefits are paid. Our expectations for the future investment returns of the
asset categories were based on a combination of historical market performance and evaluations of investment forecasts obtained from
external consultants and economists. The methodology underlying the return assumption included the various elements of the expected
return for each asset class such as long-term rates of return, volatility of returns, and the correlation of returns between various asset classes.
The expected return for the total portfolio was calculated based on the plan’s strategic asset allocation. Investment risk is measured and
monitored on an ongoing basis through annual liability measurements, periodic asset/liability studies, and quarterly investment portfolio
reviews. Risk tolerance is established through consideration of plan liabilities, plan funded status, and corporate financial condition. Our
plans prohibit the use of derivative instruments.