Unum 2007 Annual Report Download - page 40
Download and view the complete annual report
Please find page 40 of the 2007 Unum annual report below. You can navigate through the pages in the report by either clicking on the pages listed below, or by using the keyword search tool below to find specific information within the annual report.-
 1
1 -
2
-
3
-
4
-
5
-
6
-
7
-
8
-
9
-
10
-
11
-
12
-
13
-
14
-
15
-
16
-
17
-
18
-
19
-
20
-
21
-
22
-
23
-
24
-
25
-
26
-
27
-
28
-
29
-
 30
30 -
 31
31 -
 32
32 -
 33
33 -
 34
34 -
 35
35 -
 36
36 -
 37
37 -
 38
38 -
 39
39 -
 40
40 -
 41
41 -
 42
42 -
 43
43 -
 44
44 -
 45
45 -
 46
46 -
 47
47 -
 48
48 -
 49
49 -
 50
50 -
51
-
52
-
53
-
54
-
55
-
56
-
57
-
58
-
59
-
60
-
61
-
62
-
63
-
64
-
65
-
66
-
67
-
68
-
69
-
70
-
71
-
72
-
73
-
74
-
75
-
76
-
77
-
78
-
79
-
80
-
81
-
82
-
83
-
84
-
85
-
86
-
87
-
88
-
89
-
90
-
91
-
92
-
93
-
94
-
95
-
96
-
97
-
98
-
99
-
100
-
101
-
102
-
103
-
104
-
105
-
106
-
107
-
108
-
109
-
110
-
111
-
112
-
113
-
114
-
115
-
116
-
117
-
118
-
119
-
120
-
121
-
122
-
123
-
124
-
125
-
126
-
127
-
128
-
129
-
130
-
131
-
132
-
133
-
134
-
135
-
136
-
137
-
138
-
139
-
140
-
141
-
142
-
143
-
144
-
145
-
146
-
147
-
148
 |
 |

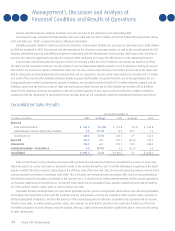
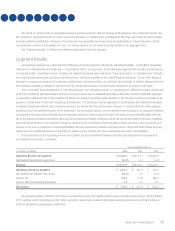
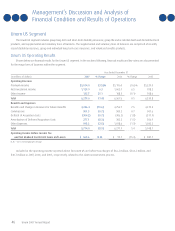
Management’s Discussion and Analysis of
Financial Condition and Results of Operations
38 Unum 2007 Annual Report
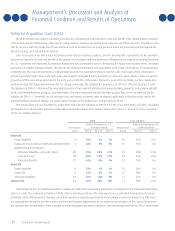
As of December 31, 2007, the key assumptions used to estimate the fair value of private placement fixed maturity securities included
the following:
•Riskfreeinterestratesof3.44percentforve-yearmaturitiesto4.45percentfor30-yearmaturitieswerederivedfromthecurrent
yield curve for U.S. Treasury Bonds with similar maturities.
•CurrentBaacorporatebondspreadsrangingfrom1.81percentto2.15percentplusanadditional20basispointswereaddedtothe
risk free rate to reflect the lack of liquidity.
•Anadditionalvebasispointswereaddedtotheriskfreeratesforforeigninvestments.
•Additionalbasispointswereaddedasdeemedappropriateforcertainindustriesandforindividualsecuritiesincertainindustries
that are considered to be of greater risk.
Increasing the 20 basis points added to the risk free rate for lack of liquidity by 1.5 basis points, increasing the five basis points added
to the risk free rates for foreign investments by one basis point, and increasing the additional basis points added to each industry considered
to be of greater risk by one basis point would have decreased the December 31, 2007 net unrealized gain in the fixed maturity securities
portfolio by approximately $1.7 million. Historically, our realized gains or losses on dispositions of private placement fixed maturity securities
have not varied significantly from amounts estimated under the valuation methodology described above.
Changes in the fair value of fixed maturity securities, other than declines that are determined to be other than temporary, are reported
as a component of other comprehensive income in stockholders’ equity. If we subsequently determine that any of these securities are
other than temporarily impaired, the impairment loss is reported as a realized investment loss in our consolidated statements of income.
The recognition of the impairment loss does not affect total stockholders’ equity to the extent that the decline in value had been previously
reflected in other comprehensive income.
There are a number of significant risks inherent in the process of monitoring our fixed maturity securities for impairments and
determining when and if an impairment is other than temporary. These risks and uncertainties include the following possibilities:
•Theassessmentofaborrower’sabilitytomeetitscontractualobligationswillchange.
•Theeconomicoutlook,eitherdomesticorforeign,maybelessfavorableormayhaveamoresignicantimpactontheborrower
than anticipated, and as such, the security may not recover in value.
•Newinformationmaybecomeavailableconcerningthesecurity,suchasdisclosureofaccountingirregularities,fraud,orcorporate
governance issues.
•Signicantchangesincreditspreadsmayoccurintherelatedindustry.
•Signicantincreasesininterestratesmayoccurandmaynotreturntolevelssimilartowhensecuritieswereinitiallypurchased.
•Adverseratingagencyactionsmayoccur.
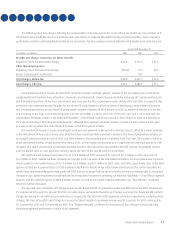
Pension and Postretirement Benefit Plans
We sponsor several defined benefit pension and other postretirement benefit (OPEB) plans for our employees, including non-qualified
pension plans. The U.S. pension plans comprise the majority of our total benefit obligation and pension expense. Our U.K. operation
maintains a separate defined benefit plan for eligible employees. The U.K. defined benefit pension plan was closed to new entrants on
December 31, 2002.
We follow Statements of Financial Accounting Standards No. 87 (SFAS 87), Employers’ Accounting for Pensions, No. 106 (SFAS 106),
Employers’ Accounting for Postretirement Benefits Other Than Pensions, No. 132 (SFAS 132), Employers’ Disclosures about Pensions and
Other Postretirement Benefits, and No. 158 (SFAS 158), Employers’ Accounting for Defined Benefit Pension and Other Postretirement
Plans, an amendment of FASB Statements No. 87, 88, 106, and 132(R) in our financial reporting and accounting for our pension and
postretirement benefit plans. See Note 10 of the “Notes to Consolidated Financial Statements” for further discussion.
Our net periodic benefit costs and the value of our benefit obligations for these plans are determined based on a set of economic
and demographic assumptions that represent our best estimate of future expected experience. Major assumptions used in accounting
for these plans include the expected discount (interest) rate and the long-term rate of return on plan assets. We also use, as applicable,
expected increases in compensation levels and a weighted-average annual rate of increase in the per capita cost of covered benefits,
which reflects a health care cost trend rate.