Unum 2007 Annual Report Download - page 44
Download and view the complete annual report
Please find page 44 of the 2007 Unum annual report below. You can navigate through the pages in the report by either clicking on the pages listed below, or by using the keyword search tool below to find specific information within the annual report.-
 1
1 -
2
-
3
-
4
-
5
-
6
-
7
-
8
-
9
-
10
-
11
-
12
-
13
-
14
-
15
-
16
-
17
-
18
-
19
-
20
-
21
-
22
-
23
-
24
-
25
-
26
-
27
-
28
-
29
-
30
-
31
-
32
-
33
-
 34
34 -
 35
35 -
 36
36 -
 37
37 -
 38
38 -
 39
39 -
 40
40 -
 41
41 -
 42
42 -
 43
43 -
 44
44 -
 45
45 -
 46
46 -
 47
47 -
 48
48 -
 49
49 -
 50
50 -
 51
51 -
 52
52 -
 53
53 -
 54
54 -
55
-
56
-
57
-
58
-
59
-
60
-
61
-
62
-
63
-
64
-
65
-
66
-
67
-
68
-
69
-
70
-
71
-
72
-
73
-
74
-
75
-
76
-
77
-
78
-
79
-
80
-
81
-
82
-
83
-
84
-
85
-
86
-
87
-
88
-
89
-
90
-
91
-
92
-
93
-
94
-
95
-
96
-
97
-
98
-
99
-
100
-
101
-
102
-
103
-
104
-
105
-
106
-
107
-
108
-
109
-
110
-
111
-
112
-
113
-
114
-
115
-
116
-
117
-
118
-
119
-
120
-
121
-
122
-
123
-
124
-
125
-
126
-
127
-
128
-
129
-
130
-
131
-
132
-
133
-
134
-
135
-
136
-
137
-
138
-
139
-
140
-
141
-
142
-
143
-
144
-
145
-
146
-
147
-
148
 |
 |

Management’s Discussion and Analysis of
Financial Condition and Results of Operations
42 Unum 2007 Annual Report
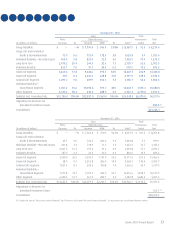
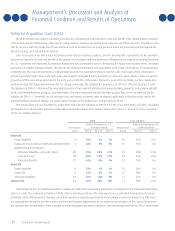
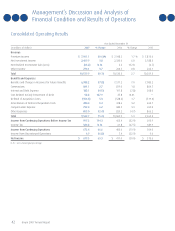
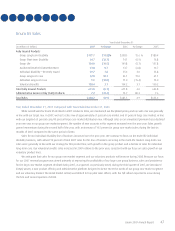
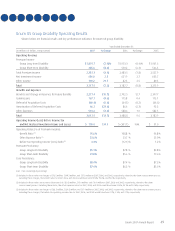
Consolidated Operating Results
Year Ended December 31
(in millions of dollars) 2007 % Change 2006 % Change 2005
Revenue
Premium Income $ 7,901.1 (0.6)% $ 7,948.2 1.7)% $ 7,815.6
Net Investment Income 2,409.9 3.8 2,320.6 6.0 2,188.3
Net Realized Investment Gain (Loss) (65.2) N.M. 2.2 132.8 (6.7)
Other Income 274.1 3.7 264.3 0.8 262.1
Total 10,519.9 (0.1) 10,535.3 2.7 10,259.3
Benefits and Expenses
Benefits and Change in Reserves for Future Benefits 6,988.2 (7.8) 7,577.2 7.0 7,083.2
Commissions 841.1 2.7 819.0 1.8 804.7
Interest and Debt Expense 183.1 (4.5) 191.8 (7.8) 208.0
Cost Related to Early Retirement of Debt 58.8 127.9 25.8 N.M. —
Deferral of Acquisition Costs (556.3) 5.3 (528.2) 1.7 (519.4)
Amortization of Deferred Acquisition Costs 480.4 0.4 478.6 3.2 463.7
Compensation Expense 722.4 6.2 680.5 3.3 659.0
Other Expenses 805.0 (2.4) 825.2 (4.7) 866.2
Total 9,522.7 (5.4) 10,069.9 5.3 9,565.4
Income from Continuing Operations Before Income Tax 997.2 114.3 465.4 (32.9) 693.9
Income Tax 324.8 N.M. 61.8 (67.5) 189.9
Income from Continuing Operations 672.4 66.6 403.6 (19.9) 504.0
Income from Discontinued Operations 6.9 (6.8) 7.4 (22.9) 9.6
Net Income $ 679.3 65.3 $ 411.0 (20.0) $ 513.6
N.M. = not a meaningful percentage