American Express 2001 Annual Report Download - page 61
Download and view the complete annual report
Please find page 61 of the 2001 American Express annual report below. You can navigate through the pages in the report by either clicking on the pages listed below, or by using the keyword search tool below to find specific information within the annual report.-
 1
1 -
2
-
3
-
4
-
5
-
6
-
7
-
8
-
9
-
10
-
11
-
12
-
13
-
14
-
15
-
16
-
17
-
18
-
19
-
20
-
21
-
22
-
23
-
24
-
25
-
26
-
27
-
28
-
29
-
30
-
31
-
32
-
33
-
34
-
35
-
36
-
37
-
38
-
39
-
40
-
41
-
42
-
43
-
44
-
45
-
46
-
47
-
48
-
49
-
50
-
 51
51 -
 52
52 -
 53
53 -
 54
54 -
 55
55 -
 56
56 -
 57
57 -
 58
58 -
 59
59 -
 60
60 -
 61
61 -
 62
62 -
 63
63 -
 64
64 -
 65
65 -
 66
66 -
 67
67 -
 68
68 -
 69
69 -
 70
70 -
 71
71 -
72
-
73
-
74
-
75
-
76
-
77
-
78
-
79
-
80
-
81
-
82
-
83
-
84
 |
 |

axp_59
NOTES TO CONSOLIDATED FINANCIAL STATEMENTS
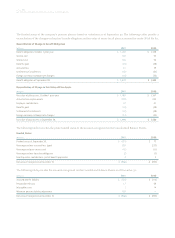
At December 31, 2001 and 2000, interest-only strips were $155 million and $272 million, respectively.
The key economic assumptions and the sensitivity of the current year’s fair value to immediate 10 percent and 20 percent adverse
changes in assumed economics are as follows:
Cash Flows from
Average Loan Life Expected Credit Retained Interests
(Millions, except rates per annum) (months) Losses Discounted at Interest Rates
Assumption 6.6 5.43% 12% 2.98%
Impact on fair value of 10% adverse change $ 16.3 $ 14.3 $ 1.8 $ 1.9
Impact on fair value of 20% adverse change $ 29.8 $ 37.6 $ 3.6 $ 3.7
These sensitivities are hypothetical and will be different from what actually occurs in the future. As the figures indicate, any change
in fair value based on a 10 percent variation in assumptions cannot be extrapolated because the relationship of the change in
assumption on the fair value of the retained interest is calculated independent from any change in another assumption; in reality,
changes in one factor may result in changes in another, which magnify or counteract the sensitivities.
The table below summarizes cash flows received from securitization trusts in:
(Millions) 2001 2000
Proceeds from new securitizations during the period $ 3,919 $ 3,630
Proceeds from reinvestment of payments in Cardmember securitizations $ 24,433 $ 12,480
Servicing fees received $ 267 $ 191
Other cash flows received on retained interests $ 1,194 $ 667
The company also securitizes equipment lease receivables. At December 31, 2001 and 2000, the amount sold and outstanding to
third party investors was $675 million and $242 million, respectively. These sales result in a reduction of interest expense and pro-
visions for losses, as well as servicing revenue, all of which are insignificant to the company’s results of operations.
Note 7 ❚SHORT- AND LONG-TERM DEBT AND BORROWING AGREEMENTS
SHORT-TERM DEBT
At December 31, 2001 and 2000, the company’s total short-term debt outstanding was $31.6 billion and $36.0 billion, respectively,
with weighted average interest rates of 3.0% and 6.5%, respectively. At December 31, 2001 and 2000, $17.1 billion and $9.7 billion,
respectively, of short-term debt outstanding was covered by interest rate swaps. The year-end weighted average effective interest
rates were 4.6% and 6.4% for 2001 and 2000, respectively. The company generally paid fixed rates of interest under the terms of
interest rate swaps. Unused lines of credit to support commercial paper borrowings were approximately $10.4 billion and $9.7
billion at December 31, 2001 and 2000, respectively.