American Express 2001 Annual Report Download - page 80
Download and view the complete annual report
Please find page 80 of the 2001 American Express annual report below. You can navigate through the pages in the report by either clicking on the pages listed below, or by using the keyword search tool below to find specific information within the annual report.-
 1
1 -
2
-
3
-
4
-
5
-
6
-
7
-
8
-
9
-
10
-
11
-
12
-
13
-
14
-
15
-
16
-
17
-
18
-
19
-
20
-
21
-
22
-
23
-
24
-
25
-
26
-
27
-
28
-
29
-
30
-
31
-
32
-
33
-
34
-
35
-
36
-
37
-
38
-
39
-
40
-
41
-
42
-
43
-
44
-
45
-
46
-
47
-
48
-
49
-
50
-
51
-
52
-
53
-
54
-
55
-
56
-
57
-
58
-
59
-
60
-
61
-
62
-
63
-
64
-
65
-
66
-
67
-
68
-
69
-
 70
70 -
 71
71 -
 72
72 -
 73
73 -
 74
74 -
 75
75 -
 76
76 -
 77
77 -
 78
78 -
 79
79 -
 80
80 -
 81
81 -
 82
82 -
 83
83 -
 84
84
 |
 |

axp_78
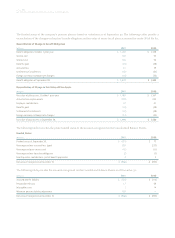
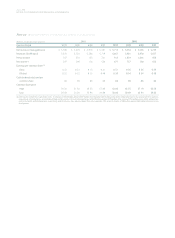
CONSOLIDATED FIVE-YEAR SUMMARY OF SELECTED FINANCIAL DATA
Consolidated Five-year Summary of Selected Financial Data
(Millions, except per share amounts and percentages) 2001 2000 1999 1998 1997
OPERATING RESULTS
Net revenues (managed basis)(a) $ 21,359 $ 22,085 $ 19,483 $ 17,212 $ 15,857
Percent (decrease) increase (3)% 13% 13% 9% 10%
Revenues (GAAP basis) 22,582 23,675 21,278 19,132 17,760
Percent (decrease) increase (5)% 11% 11% 8% 8%
Expenses 20,986 19,767 17,840 16,207 15,010
Net income(b) 1,311 2,810 2,475 2,141 1,991
Return on average shareholders’ equity(c) 10.9% 25.3% 25.3% 24.0% 23.5%
BALANCE SHEET
Cash and cash equivalents $ 7,222 $ 8,487 $ 7,471 $ 4,092 $ 4,179
Accounts receivable and accrued interest, net 29,498 30,543 26,467 22,224 21,774
Investments 46,488 43,747 43,052 41,299 39,648
Loans, net 26,440 26,088 23,582 21,054 20,109
Total assets 151,100 154,423 148,517 126,933 120,003
Customers’ deposits 14,557 13,870 13,139 10,398 9,444
Travelers Cheques outstanding 6,190 6,127 6,213 5,823 5,634
Insurance and annuity reserves 24,536 24,098 25,011 25,433 26,165
Short-term debt 31,569 36,030 30,627 22,605 20,570
Long-term debt 7,788 4,711 5,995 7,019 7,873
Shareholders’ equity 12,037 11,684 10,095 9,698 9,574
COMMON SHARE STATISTICS
Earnings per share(b):
Basic $ 0.99 $ 2.12 $ 1.85 $ 1.57 $ 1.43
Diluted $ 0.98 $ 2.07 $ 1.81 $ 1.54 $ 1.38
Percent (decrease) increase:
Basic (53)% 15% 18% 10% 7%
Diluted (53)% 14% 18% 12% 6%
Cash dividends declared per share $ 0.32 $ 0.32 $ 0.30 $ 0.30 $ 0.30
Book value per share:
Actual $ 9.05 $ 8.81 $ 7.52 $ 7.18 $ 6.84
Pro forma(c) $ 9.02 $ 8.92 $ 7.74 $ 6.75 $ 6.43
Market price per share:
High $ 57.06 $ 63.00 $ 56.29 $ 39.54 $ 30.50
Low $ 24.20 $ 39.83 $ 31.63 $ 22.33 $ 17.88
Close $ 35.69 $ 54.94 $ 55.42 $ 34.17 $ 29.75
Average common shares outstanding for earnings
per share:
Basic 1,324 1,327 1,340 1,363 1,393
Diluted 1,336 1,360 1,369 1,388 1,438
Shares outstanding at year end 1,331 1,326 1,341 1,351 1,399
OTHER STATISTICS
Number of employees at year end:
United States 48,698 53,352 52,858 50,266 44,691
Outside United States 35,719 35,498 35,520 34,466 28,929
Total 84,417 88,850 88,378 84,732 73,620
Number of shareholders of record 52,041 53,884 56,020 51,597 53,576
(a)Net revenues (managed basis) are total revenues as reported under U.S. Generally Accepted Accounting Principles (GAAP), net of American Express Financial Advisors’ provision for
losses and benefits, and exclude the effect of TRS’ asset securitization activities.
(b)Results for 2001 include three significant items: (1) a charge of $1.01 billion pretax ($669 million after-tax) reflecting losses associated with high-yield securities recorded during the
first half of 2001; (2) restructuring charges of $631 million pretax ($411 million after-tax); and (3) the one-time adverse impact from the September 11th terrorist attacks of $98 million
pretax ($65 million after-tax). Results for 1998 include the following items: $138 million credit loss provision at American Express Bank relating to its Asia/Pacific portfolio and income
of $78 million representing gains on the sale of First Data Corporation shares.
(c) Return on average shareholders’ equity and book value per share excludes the effect of SFAS No. 115 and, in 2001, SFAS No. 133.