American Express 2001 Annual Report Download - page 76
Download and view the complete annual report
Please find page 76 of the 2001 American Express annual report below. You can navigate through the pages in the report by either clicking on the pages listed below, or by using the keyword search tool below to find specific information within the annual report.-
 1
1 -
2
-
3
-
4
-
5
-
6
-
7
-
8
-
9
-
10
-
11
-
12
-
13
-
14
-
15
-
16
-
17
-
18
-
19
-
20
-
21
-
22
-
23
-
24
-
25
-
26
-
27
-
28
-
29
-
30
-
31
-
32
-
33
-
34
-
35
-
36
-
37
-
38
-
39
-
40
-
41
-
42
-
43
-
44
-
45
-
46
-
47
-
48
-
49
-
50
-
51
-
52
-
53
-
54
-
55
-
56
-
57
-
58
-
59
-
60
-
61
-
62
-
63
-
64
-
65
-
 66
66 -
 67
67 -
 68
68 -
 69
69 -
 70
70 -
 71
71 -
 72
72 -
 73
73 -
 74
74 -
 75
75 -
 76
76 -
 77
77 -
 78
78 -
 79
79 -
 80
80 -
 81
81 -
 82
82 -
 83
83 -
 84
84
 |
 |

axp_74
NOTES TO CONSOLIDATED FINANCIAL STATEMENTS
Income tax provision (benefit) is calculated on a separate return basis; however, benefits from operating losses, loss carrybacks and
tax credits (principally foreign tax credits) recognizable for the company’s consolidated reporting purposes are allocated based
upon the tax sharing agreement among members of the American Express Company consolidated U.S. tax group.
Assets are those that are used or generated exclusively by each industry segment. The adjustments and eliminations required to
determine the consolidated amounts shown above consist principally of the elimination of inter-segment amounts.
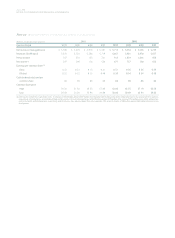
GEOGRAPHIC OPERATIONS
The following table presents the company’s revenues and pretax income in different geographic regions.
Adjustments
United and
(Millions) States Europe Asia/Pacific All Other Eliminations Consolidated
2001
Revenues $ 17,522 $ 2,556 $ 1,523 $ 1,667 $ (686) $ 22,582
Pretax income $ 1,177 $ 101 $ 159 $ 159
—
$ 1,596
2000
Revenues $ 18,529 $ 2,731 $ 1,582 $ 1,629 $ (796) $ 23,675
Pretax income $ 3,049 $ 411 $ 199 $ 249
—
$ 3,908
1999
Revenues $ 16,362 $ 2,729 $ 1,456 $ 1,466 $ (735) $ 21,278
Pretax income $ 2,756 $ 316 $ 175 $ 191
—
$ 3,438
Most services of the company are provided on an integrated worldwide basis. Therefore, it is not practical to separate precisely
the U.S. and international services. Accordingly, the data in the above table are, in part, based upon internal allocations, which
necessarily involve management’s judgment.
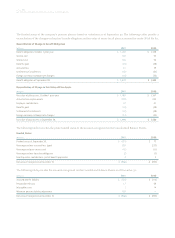
Note 19 ❚TRANSFER OF FUNDS FROM SUBSIDIARIES
The SEC requires the disclosure of certain restrictions on the flow of funds to a parent company from its subsidiaries in the form
of loans, advances or dividends.
Restrictions on the transfer of funds exist under debt agreements and regulatory requirements of certain of the company’s
subsidiaries. These restrictions have not had any effect on the company’s shareholder dividend policy and management does not
anticipate any effect in the future.
At December 31, 2001, the aggregate amount of net assets of subsidiaries that may be transferred to the Parent Company was
approximately $8.6 billion. Should specific additional needs arise, procedures exist to permit immediate transfer of short-term
funds between the company and its subsidiaries, while complying with the various contractual and regulatory constraints on the
internal transfer of funds.