American Express 2001 Annual Report Download - page 7
Download and view the complete annual report
Please find page 7 of the 2001 American Express annual report below. You can navigate through the pages in the report by either clicking on the pages listed below, or by using the keyword search tool below to find specific information within the annual report.-
 1
1 -
 2
2 -
 3
3 -
 4
4 -
 5
5 -
 6
6 -
 7
7 -
 8
8 -
 9
9 -
 10
10 -
 11
11 -
 12
12 -
 13
13 -
 14
14 -
 15
15 -
 16
16 -
 17
17 -
 18
18 -
19
-
20
-
21
-
22
-
23
-
24
-
25
-
26
-
27
-
28
-
29
-
30
-
31
-
32
-
33
-
34
-
35
-
36
-
37
-
38
-
39
-
40
-
41
-
42
-
43
-
44
-
45
-
46
-
47
-
48
-
49
-
50
-
51
-
52
-
53
-
54
-
55
-
56
-
57
-
58
-
59
-
60
-
61
-
62
-
63
-
64
-
65
-
66
-
67
-
68
-
69
-
70
-
71
-
72
-
73
-
74
-
75
-
76
-
77
-
78
-
79
-
80
-
81
-
82
-
83
-
84
 |
 |

Together, these issues had a profound negative impact on nearly every aspect
of our card, travel and financial services businesses. The impact was evident in
many of the business indicators I will discuss later in this report. It was also
evident in three significant items:
❚A first-half charge of $1.01 billion pretax ($669 million after-tax), reflecting
write downs in the investment portfolio held by American Express Financial
Advisors (AEFA) and losses associated with rebalancing the portfolio toward
lower-risk securities;
❚Restructuring charges in the third and fourth quarters, totaling $631 mil-
lion pretax ($411 million after-tax), primarily to cover the cost of reducing
our workforce. In combination with reductions identified earlier in the year,
we are reducing our staffing levels by approximately 16 percent or 14,500
jobs; and
❚The one-time costs and business interruption losses of $98 million pretax ($65
million after-tax) resulting from the September 11 attacks.
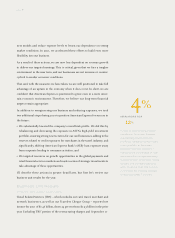
As a result, our financial performance in 2001 fell far short of our long-term
targets of 12 to 15 percent growth in earnings per share, return on equity of 18
to 20 percent and revenue growth of 8 percent, on average and over time:
❚Net income was $1.31 billion, down 53 percent from $2.81 billion in 2000.
Diluted earnings per share declined 53 percent to $0.98 from $2.07.
❚Net revenues on a managed basis totaled $21.4 billion, down 3 percent from
$22.1 billion in 2000.
❚Return on equity was 10.9 percent, compared with 25.3 percent in 2000.
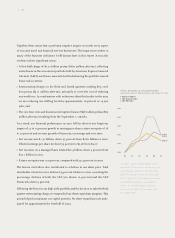
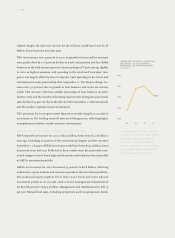
The factors cited above also contributed to a decline in our share price. Total
shareholder return for 2001 declined 34 percent relative to 2000, exceeding the
percentage declines of both the S&P 500 (down 12 percent) and the S&P
Financials (down 9 percent).
Following the losses in our high-yield portfolio and the decision to take the third
quarter restructuring charge, we suspended our share repurchase program. This
action helped us maintain our capital position. No share repurchases are antic-
ipated for approximately the first half of 2002.
axp_5
TOTAL RETURN TO SHAREHOLDERS
Cumulative Value of $100 invested on December 31, 1996
❚American Express
❚S&P financial index
❚S&P 500 index
$100
$150
$200
$250
$300
$350
$197.14
$197.10
$166.24
010099989796
In 2001, total shareholder return
declined 34 percent, exceeding the
percentage declines of both the
S&P Financial Index and the S&P
500 Index. For the past five years,
American Express’ cumulative
return to shareholders outper-
formed the S&P Financials and
the S&P 500.