American Express 2001 Annual Report Download - page 72
Download and view the complete annual report
Please find page 72 of the 2001 American Express annual report below. You can navigate through the pages in the report by either clicking on the pages listed below, or by using the keyword search tool below to find specific information within the annual report.-
 1
1 -
2
-
3
-
4
-
5
-
6
-
7
-
8
-
9
-
10
-
11
-
12
-
13
-
14
-
15
-
16
-
17
-
18
-
19
-
20
-
21
-
22
-
23
-
24
-
25
-
26
-
27
-
28
-
29
-
30
-
31
-
32
-
33
-
34
-
35
-
36
-
37
-
38
-
39
-
40
-
41
-
42
-
43
-
44
-
45
-
46
-
47
-
48
-
49
-
50
-
51
-
52
-
53
-
54
-
55
-
56
-
57
-
58
-
59
-
60
-
61
-
 62
62 -
 63
63 -
 64
64 -
 65
65 -
 66
66 -
 67
67 -
 68
68 -
 69
69 -
 70
70 -
 71
71 -
 72
72 -
 73
73 -
 74
74 -
 75
75 -
 76
76 -
 77
77 -
 78
78 -
 79
79 -
 80
80 -
 81
81 -
 82
82 -
83
-
84
 |
 |

axp_70
NOTES TO CONSOLIDATED FINANCIAL STATEMENTS
The projected benefit obligation, accumulated benefit obligation and fair value of plan assets for the pension plans with accumu-
lated benefit obligations in excess of plan assets were $612 million, $553 million and $326 million, respectively, as of December 31,
2001, and $191 million, $171 million and $16 million, respectively, as of December 31, 2000. As a result of a significant decrease in
the fair value of plan assets in certain non-U.S. pension plans, more plans had an accumulated benefit obligation that exceeded the
fair value of the plan assets, and a minimum liability adjustment was required.
The prior service costs are amortized on a straight-line basis over the average remaining service period of active participants. Gains
and losses in excess of 10 percent of the greater of the benefit obligation and the market-related value of assets are amortized over
the average remaining service period of active participants.
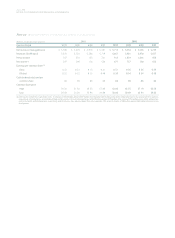
The weighted average assumptions used in the company’s defined benefit plans were:
2001 2000
Discount rates 7.0% 7.4%
Rates of increase in compensation levels 4.2% 4.4%
Expected long-term rates of return on assets 9.5% 9.5%
The company also has a defined contribution retirement plan (a 401(k) savings plan with a profit sharing feature) covering most
employees in the United States. The defined contribution plan expense was $76 million, $151 million and $131 million in 2001,
2000 and 1999, respectively.
OTHER POSTRETIREMENT BENEFITS
The company sponsors postretirement benefit plans that provide health care, life insurance and other postretirement benefits to
retired U.S. employees. Net periodic postretirement benefit expenses were $25 million, $26 million and $20 million in 2001, 2000
and 1999, respectively. The liabilities recognized on the Consolidated Balance Sheets for the company’s defined postretirement
benefit plans (other than pension plans) at December 31, 2001 and 2000 were $212 million and $211 million, respectively.
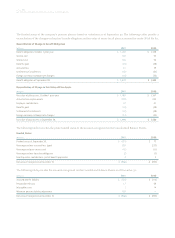
Note 16 ❚INCOME TAXES
The (benefits) provisions for income taxes were as follows:
(Millions) 2001 2000 1999
Federal $ (36) $ 748 $ 645
State and local 59 76 76
Foreign 262 274 242
Total $ 285 $ 1,098 $ 963
Accumulated net earnings of certain foreign subsidiaries, which totaled $2.1 billion at December 31, 2001, are intended to be per-
manently reinvested outside the United States. Accordingly, federal taxes, which would have aggregated $312 million, have not
been provided on those earnings.
The current and deferred components of the provision for income taxes were as follows:
(Millions) 2001 2000 1999
Current $ 765 $ 1,209 $ 716
Deferred (480) (111) 247
Total $ 285 $ 1,098 $ 963