American Express 2005 Annual Report Download - page 15
Download and view the complete annual report
Please find page 15 of the 2005 American Express annual report below. You can navigate through the pages in the report by either clicking on the pages listed below, or by using the keyword search tool below to find specific information within the annual report.-
 1
1 -
2
-
3
-
4
-
 5
5 -
 6
6 -
 7
7 -
 8
8 -
 9
9 -
 10
10 -
 11
11 -
 12
12 -
 13
13 -
 14
14 -
 15
15 -
 16
16 -
 17
17 -
 18
18 -
 19
19 -
 20
20 -
 21
21 -
 22
22 -
 23
23 -
 24
24 -
 25
25 -
26
-
27
-
28
-
29
-
30
-
31
-
32
-
33
-
34
-
35
-
36
-
37
-
38
-
39
-
40
-
41
-
42
-
43
-
44
-
45
-
46
-
47
-
48
-
49
-
50
-
51
-
52
-
53
-
54
-
55
-
56
-
57
-
58
-
59
-
60
-
61
-
62
-
63
-
64
-
65
-
66
-
67
-
68
-
69
-
70
-
71
-
72
-
73
-
74
-
75
-
76
-
77
-
78
-
79
-
80
-
81
-
82
-
83
-
84
-
85
-
86
-
87
-
88
-
89
-
90
-
91
-
92
-
93
-
94
-
95
-
96
-
97
-
98
-
99
-
100
-
101
-
102
-
103
-
104
-
105
-
106
 |
 |

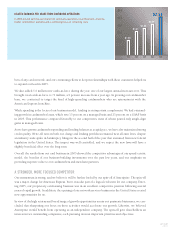
DELIVERING SHAREHOLDER RETURNS
The financial characteristics of the new American Express — earnings growth, return on equity, payout ratio
and valuation — compare favorably with many of the top long-term growth companies, regardless of indus-
try. We believe that managing the business for consistent growth and profitability over the long term should
continue to generate substantial shareholder value.
At year end, our stock’s price-to-earnings ratio was among the highest of any of the top 25 global financial
services companies, reflecting investor confidence in the current strengths of our business and the company’s
long-term potential.
In the lackluster equity market environment of 2005, shares of American Express stock produced a total
return to shareholders of 5 percent. We out-performed the Dow Jones Industrials and most of our peers in
the card industry, performed in line with the S&P 500, and slightly under-performed the S&P Financials,
where most of the gains came from the insurance and brokerage sectors. Cumulatively, over the past three
years, American Express’ stock has out-performed these three key indices and almost all of our peer compa-
nies in total shareholder returns.
In looking at shareholder performance in 2005, it’s also important to recognize the additional value that
American Express shareholders gained from the Ameriprise spin-off. Those who received the spin-off dividend
of Ameriprise shares and held their shares through the end of the year saw them appreciate by more than
14 percent.
American Express returned 48 percent of capital to shareholders in 2005 through share repurchases and
regular dividends. This reflects a more measured approach toward share repurchases in light of the capital
implications of the Ameriprise spin-off. Over the past decade, we have met our capital return target of 65 percent,
on average and over time, and we remain committed to this long-term objective.
A DEEPER LOOK AT RESULTS
Across our lines of business in 2005, American Express moved aggressively to develop and market new prod-
ucts, rewards and services to deliver more value to our customers and earn more of their business. Here is a
deeper look at some of these efforts.
Proprietary Consumer and Small Business Cards
Innovative products, rewards and enhanced services helped increase spending among consumer and small-
business cardmembers around the world. In the United States, billed business rose 15 percent on consumer
cards and 20 percent on small-business cards. In international markets, we saw a 13 percent gain in consumer
and small-business spending, excluding the impact of foreign exchange translation.
AXP / AR.2005
[ 13 ]