American Express 2005 Annual Report Download - page 76
Download and view the complete annual report
Please find page 76 of the 2005 American Express annual report below. You can navigate through the pages in the report by either clicking on the pages listed below, or by using the keyword search tool below to find specific information within the annual report.-
 1
1 -
2
-
3
-
4
-
5
-
6
-
7
-
8
-
9
-
10
-
11
-
12
-
13
-
14
-
15
-
16
-
17
-
18
-
19
-
20
-
21
-
22
-
23
-
24
-
25
-
26
-
27
-
28
-
29
-
30
-
31
-
32
-
33
-
34
-
35
-
36
-
37
-
38
-
39
-
40
-
41
-
42
-
43
-
44
-
45
-
46
-
47
-
48
-
49
-
50
-
51
-
52
-
53
-
54
-
55
-
56
-
57
-
58
-
59
-
60
-
61
-
62
-
63
-
64
-
65
-
 66
66 -
 67
67 -
 68
68 -
 69
69 -
 70
70 -
 71
71 -
 72
72 -
 73
73 -
 74
74 -
 75
75 -
 76
76 -
 77
77 -
 78
78 -
 79
79 -
 80
80 -
 81
81 -
 82
82 -
 83
83 -
 84
84 -
 85
85 -
 86
86 -
87
-
88
-
89
-
90
-
91
-
92
-
93
-
94
-
95
-
96
-
97
-
98
-
99
-
100
-
101
-
102
-
103
-
104
-
105
-
106
 |
 |

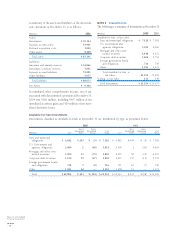
A summary of the assets and liabilities of the discontin-
ued operations at December 31 is as follows:
(Millions) 2004
Assets:
Investments $ 39,134
Separate account assets 35,901
Deferred acquisition costs 3,838
Other assets 8,268
Total assets $ 87,141
Liabilities:
Insurance and annuity reserves $ 32,966
Investment certificate reserves 5,831
Separate account liabilities 35,901
Other liabilities 5,977
Total liabilities $ 80,675
Net Assets $ 6,466
Accumulated other comprehensive income, net of tax,
associated with discontinued operations at December 31,
2004 was $360 million, including $407 million of net
unrealized securities gains and $29 million of net unre-
alized derivative losses.
NOTE 3 Investments
The following is a summary of investments at December 31:
(Millions) 2005 2004
Available-for-Sale, at fair value
State and municipal obligations $ 7,120 $ 7,381
U.S. Government and
agencies obligations 5,033 4,060
Mortgage and other asset-
backed securities 3,838 4,322
Corporate debt securities 3,202 3,751
Foreign government bonds
and obligations 716 750
Other 1,194 1,171
Total Available-for-Sale, at
fair value 21,103 21,435
Trading, at fair value 231 240
Total Investments $ 21,334 $ 21,675
Available-for-Sale Investments
Investments classified as Available-for-Sale at December 31 are distributed by type as presented below:
2005 2004
(Millions) Cost
Gross
Unrealized
Gains
Gross
Unrealized
Losses Fair
Value Cost
Gross
Unrealized
Gains
Gross
Unrealized
Losses Fair
Value
State and municipal
obligations $ 6,832 $ 293 $ (5) $ 7,120 $ 6,982 $ 404 $ (5) $ 7,381
U.S. Government and
agencies obligations 5,080 1 (48) 5,033 4,109 1 (50) 4,060
Mortgage and other asset-
backed securities 3,900 13 (75) 3,838 4,295 50 (23) 4,322
Corporate debt securities 3,170 79 (47) 3,202 3,627 137 (13) 3,751
Foreign government bonds
and obligations 718 7 (9) 716 741 16 (7) 750
Other 1,184 10 — 1,194 1,158 13 — 1,171
Total $ 20,884 $ 403 $ (184) $ 21,103 $ 20,912 $ 621 $ (98) $ 21,435
Notes to Consolidated
Financial Statements
AXP / AR.2005
[74 ]