American Express 2005 Annual Report Download - page 80
Download and view the complete annual report
Please find page 80 of the 2005 American Express annual report below. You can navigate through the pages in the report by either clicking on the pages listed below, or by using the keyword search tool below to find specific information within the annual report.-
 1
1 -
2
-
3
-
4
-
5
-
6
-
7
-
8
-
9
-
10
-
11
-
12
-
13
-
14
-
15
-
16
-
17
-
18
-
19
-
20
-
21
-
22
-
23
-
24
-
25
-
26
-
27
-
28
-
29
-
30
-
31
-
32
-
33
-
34
-
35
-
36
-
37
-
38
-
39
-
40
-
41
-
42
-
43
-
44
-
45
-
46
-
47
-
48
-
49
-
50
-
51
-
52
-
53
-
54
-
55
-
56
-
57
-
58
-
59
-
60
-
61
-
62
-
63
-
64
-
65
-
66
-
67
-
68
-
69
-
 70
70 -
 71
71 -
 72
72 -
 73
73 -
 74
74 -
 75
75 -
 76
76 -
 77
77 -
 78
78 -
 79
79 -
 80
80 -
 81
81 -
 82
82 -
 83
83 -
 84
84 -
 85
85 -
 86
86 -
 87
87 -
 88
88 -
 89
89 -
 90
90 -
91
-
92
-
93
-
94
-
95
-
96
-
97
-
98
-
99
-
100
-
101
-
102
-
103
-
104
-
105
-
106
 |
 |

lending. Securitization transaction costs are offset
against the gains on sales at the time of the transaction.
During 2005, 2004 and 2003, the Company sold
$5.4 billion, $3.9 billion and $3.5 billion, respectively,
of cardmember loans, or $5.4 billion, $3.9 billion and
$3.1 billion, respectively, net of the Company’s invest-
ments in subordinated retained interests. Additionally,
during 2005, 2004 and 2003, $4.5 billion, $3.0 billion
and $1.0 billion, respectively, of securities issued to
investors from the Lending Trust matured. The pretax
net gains on sale from securitizations, including the sale
of subordinated retained interests, net of the impact of
maturities, the effect of changes in interest-only strip
valuation factors and a reconciliation adjustment charge
were $21 million, $26 million and $124 million, respec-
tively, for 2005, 2004 and 2003.
Management utilizes certain estimates and assumptions
to determine the fair value of the subordinated retained
interests, including the interest-only strip. These esti-
mates and assumptions are generally based on projec-
tions of finance charges and fees paid related to the secu-
ritized assets, net credit losses, average loan life, the
contractual fee to service the transferred assets and a dis-
count rate commensurate with the retained interest.
Changes in the estimates and assumptions used may
have a significant impact in the Company’s fair valua-
tion. The key economic assumptions used in measuring
the subordinated retained interests at the time of issu-
ance and during 2005 and 2004 were as follows (rates
are per annum):
2005 2004
Weighted average loan
life (months) 44
Expected credit losses 3.30%–3.90% 3.98%–4.67%
Subordinated certificates
discounted at 2.6%–4.8% 1.2%–3.5%
Residual cash flows
discounted at 12.0% 8.3%–12.0%
Returns to investors
Variable
Fixed
Contractual
spread
over LIBOR
ranging from
.00% to .90%
1.7%–5.8%
Contractual
spread
over LIBOR
ranging from
.04% to .90%
1.7%–7.4%
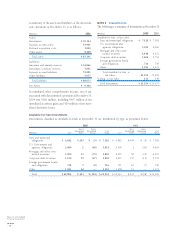
The following table presents quantitative information
about delinquencies, net credit losses and components
of securitized cardmember loans on a trust basis at
December 31:
(Billions)
Total
Principal
Amount
of Loans
Principal
Amount of
Loans 30
Days or
More Past
Due
Net
Credit
Losses
During
the Year
2005
Cardmember loans managed $ 54.3 $ 1.3 $ 2.1
Less: Securitized
cardmember loans sold 21.2 0.6 1.0
Cardmember loans on
balance sheet $ 33.1 $ 0.7 $ 1.1
2004
Cardmember loans managed $ 47.2 $ 1.2 $ 2.0
Less: Securitized
cardmember loans sold 20.3 0.6 1.0
Cardmember loans on
balance sheet $ 26.9 $ 0.6 $ 1.0
The key economic assumptions and the sensitivity of the
current year’s fair value of the interest-only strip to
immediate 10 percent and 20 percent adverse changes
in assumed economics are as follows:
(Millions, except rates per annum)
Monthly
Payment
Rate
Expected
Credit
Losses
Cash Flows from
Interest-only
Strips
Discounted at
Assumption 26.2% 3.5% 12.0%
Impact on fair value of
10% adverse change $ 13 $ 17 $ 0.4
Impact on fair value of
20% adverse change $ 26 $ 34 $ 0.8
These sensitivities are hypothetical and will be different
from what actually occurs in the future. Any change in
fair value based on a 10 percent variation in assumptions
cannot be extrapolated in part because the relationship
of the change in an assumption on the fair value of the
retained interest is calculated independent from any
change in another assumption; in reality, changes in one
factor may result in changes in another, which magnify
or offset the sensitivities.
Notes to Consolidated
Financial Statements
AXP / AR.2005
[78 ]