American Express 2005 Annual Report Download - page 77
Download and view the complete annual report
Please find page 77 of the 2005 American Express annual report below. You can navigate through the pages in the report by either clicking on the pages listed below, or by using the keyword search tool below to find specific information within the annual report.-
 1
1 -
2
-
3
-
4
-
5
-
6
-
7
-
8
-
9
-
10
-
11
-
12
-
13
-
14
-
15
-
16
-
17
-
18
-
19
-
20
-
21
-
22
-
23
-
24
-
25
-
26
-
27
-
28
-
29
-
30
-
31
-
32
-
33
-
34
-
35
-
36
-
37
-
38
-
39
-
40
-
41
-
42
-
43
-
44
-
45
-
46
-
47
-
48
-
49
-
50
-
51
-
52
-
53
-
54
-
55
-
56
-
57
-
58
-
59
-
60
-
61
-
62
-
63
-
64
-
65
-
66
-
 67
67 -
 68
68 -
 69
69 -
 70
70 -
 71
71 -
 72
72 -
 73
73 -
 74
74 -
 75
75 -
 76
76 -
 77
77 -
 78
78 -
 79
79 -
 80
80 -
 81
81 -
 82
82 -
 83
83 -
 84
84 -
 85
85 -
 86
86 -
 87
87 -
88
-
89
-
90
-
91
-
92
-
93
-
94
-
95
-
96
-
97
-
98
-
99
-
100
-
101
-
102
-
103
-
104
-
105
-
106
 |
 |

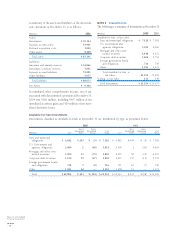
The following table provides information about Available-for-Sale investments with gross unrealized losses and the
length of time that individual securities have been in a continuous unrealized loss position as of December 31, 2005:
(Millions) Less than 12 months 12 months or more Total
Description of Securities Fair
Value
Gross
Unrealized
Losses Fair
Value
Gross
Unrealized
Losses Fair
Value
Gross
Unrealized
Losses
State and municipal obligations $ 392 $ (4) $ 19 $ (1) $ 411 $ (5)
U.S. Government and
agencies obligations 1,716 (17) 2,893 (31) 4,609 (48)
Mortgage and other asset-
backed securities 1,803 (31) 1,298 (44) 3,101 (75)
Corporate debt securities 750 (15) 821 (32) 1,571 (47)
Foreign government bonds
and obligations 283 (2) 58 (7) 341 (9)
Other 10—6—16—
Total $ 4,954 $ (69) $ 5,095 $ (115) $ 10,049 $ (184)
In evaluating potential other-than-temporary impairments, the Company considers the extent to which amortized
cost exceeds fair value and the duration and size of that difference. A key metric in performing this evaluation is
the ratio of fair value to amortized cost. The following table summarizes the unrealized losses of temporary impair-
ments by ratio of fair value to cost as of December 31, 2005:
(Millions, except
number of securities) Less than 12 months 12 months or more Total
Ratio of Fair Value to
Amortized Cost
Number of
Securities
Fair
Value
Gross
Unrealized
Losses
Number of
Securities
Fair
Value
Gross
Unrealized
Losses
Number of
Securities
Fair
Value
Gross
Unrealized
Losses
95%–100% 700 $ 4,940 $ (67) 254 $ 4,862 $ (97) 954 $ 9,802 $ (164)
90%–95% 12 11 (1) 17 177 (10) 29 188 (11)
Less than 90% 1 3 (1) 63 56 (8) 64 59 (9)
Total 713 $ 4,954 $ (69) 334 $ 5,095 $ (115) 1,047 $ 10,049 $ (184)
Substantially all of the gross unrealized losses on the
securities are attributable to changes in interest rates.
Credit spreads and specific credit events associated with
individual issuers can also cause unrealized losses
although these impacts are not significant as of
December 31, 2005.
The securities which have fair value to cost ratio of less
than 90−95 percent are comprised primarily of Federal
National Mortgage Association and Federal Home
Loan Mortgage Corporation issued mortgage-backed
securities, as well as foreign government and specific
corporate issued bonds. The Company expects that all
contractual principal and interest will be received on
these securities.
The unrealized losses in the other categories are not
concentrated in any individual industries or with any
individual securities. The Company monitors the
investments and metrics discussed above on a quarterly
basis to identify and evaluate investments that have indi-
cations of possible other-than-temporary impairment.
The Company has the ability and intent to hold these
securities for a time sufficient to recover a significant
amount of their amortized cost.
The change in net unrealized securities gains (losses) in
other comprehensive income includes the following
components: (i) unrealized gains (losses) that arose from
changes in market value of securities that were held dur-
ing the period (holding gains (losses)) and (ii) gains
(losses) that were previously unrealized, but have been
recognized in current period net income due to sales and
other-than-temporary impairments of Available-for-Sale
securities (reclassification for realized (gains) losses).
Notes to Consolidated
Financial Statements
AXP / AR.2005
[75 ]