American Express 2005 Annual Report Download - page 78
Download and view the complete annual report
Please find page 78 of the 2005 American Express annual report below. You can navigate through the pages in the report by either clicking on the pages listed below, or by using the keyword search tool below to find specific information within the annual report.-
 1
1 -
2
-
3
-
4
-
5
-
6
-
7
-
8
-
9
-
10
-
11
-
12
-
13
-
14
-
15
-
16
-
17
-
18
-
19
-
20
-
21
-
22
-
23
-
24
-
25
-
26
-
27
-
28
-
29
-
30
-
31
-
32
-
33
-
34
-
35
-
36
-
37
-
38
-
39
-
40
-
41
-
42
-
43
-
44
-
45
-
46
-
47
-
48
-
49
-
50
-
51
-
52
-
53
-
54
-
55
-
56
-
57
-
58
-
59
-
60
-
61
-
62
-
63
-
64
-
65
-
66
-
67
-
 68
68 -
 69
69 -
 70
70 -
 71
71 -
 72
72 -
 73
73 -
 74
74 -
 75
75 -
 76
76 -
 77
77 -
 78
78 -
 79
79 -
 80
80 -
 81
81 -
 82
82 -
 83
83 -
 84
84 -
 85
85 -
 86
86 -
 87
87 -
 88
88 -
89
-
90
-
91
-
92
-
93
-
94
-
95
-
96
-
97
-
98
-
99
-
100
-
101
-
102
-
103
-
104
-
105
-
106
 |
 |

The following table presents these components of other
comprehensive (loss) income net of tax for the years
ended December 31:
(Millions, net of tax) 2005 2004 2003
Holding losses $ (187) $ (83) $ (157)
Reclassification for
realized gains (11) (35) (31)
Other (losses) gains (18) (53) 15
Net unrealized securities
losses in other
comprehensive
(losses) income $ (216) $(171) $ (173)
As of December 31, 2004, net unrealized securities
gains, net of tax, reflected in accumulated other compre-
hensive income were $760 million, including $407 mil-
lion associated with discontinued operations. For 2005
activity, excluded from the table above is $391 million
of net change in accumulated other comprehensive
income related to discontinued operations. As of
December 31, 2005, net unrealized securities gains, net
of tax, reflected in accumulated other comprehensive
income were $137 million.
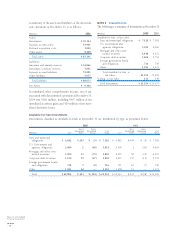
The following is a distribution of investments
classified as Available-for-Sale by maturity as of
December 31, 2005:
(Millions) Cost Fair
Value
Due within 1 year $ 4,764 $ 4,744
Due after 1 year through 5 years 4,382 4,380
Due after 5 years through
10 years 1,392 1,454
Due after 10 years 6,350 6,588
16,888 17,166
Mortgage and other asset-
backed securities 3,900 3,838
Equity securities 26 29
Retained interests in lending
securitizations 70 70
Total $ 20,884 $ 21,103
The expected payments on mortgage and other asset-
backed securities and retained interests in lending
securitizations may not coincide with their contractual
maturities. As such, these securities, as well as equity
securities, are not included in the maturities distribution.
The table below includes purchases, sales and maturities
of investments classified as Available-for-Sale for the
years ended December 31:
(Billions) 2005 2004
Purchases $12 $11
Sales $4 $5
Maturities $8 $3
Included in net investment income are gross realized
gains and losses on sales of securities, as well as other-
than-temporary losses on investments classified as
Available-for-Sale, as noted in the following table for the
years ended December 31:
(Millions) 2005 2004 2003
Gross investment gains from
sales and prepayments:
U.S. Card Services $13 $15 $26
International Card &
Global Commercial
Services 8627
Corporate & Other —2—
Total $21 $23 $53
Gross investment losses from
sales and prepayments:
U.S. Card Services $ (3) $ — $ (1)
International Card &
Global Commercial
Services (1) (1) (4)
Corporate & Other —— (1)
Total $ (4) $ (1) $ (6)
Other-than-temporary
impairments:
U.S. Card Services $— $ (7) $ —
International Card &
Global Commercial
Services —(1) (11)
Corporate & Other —(2) —
Total $— $ (10) $ (11)
Trading Investments
Trading investments are comprised principally of cer-
tain foreign government bonds and seed money invest-
ments in mutual funds for which the Company’s equity
ownership is less than 20 percent. There were $16 mil-
lion, $13 million and $9 million of net gains for 2005,
2004 and 2003, respectively, related to trading invest-
ments held at each balance sheet date.
Notes to Consolidated
Financial Statements
AXP / AR.2005
[76 ]