American Express 2005 Annual Report Download - page 7
Download and view the complete annual report
Please find page 7 of the 2005 American Express annual report below. You can navigate through the pages in the report by either clicking on the pages listed below, or by using the keyword search tool below to find specific information within the annual report.-
 1
1 -
 2
2 -
 3
3 -
 4
4 -
 5
5 -
 6
6 -
 7
7 -
 8
8 -
 9
9 -
 10
10 -
 11
11 -
 12
12 -
 13
13 -
 14
14 -
 15
15 -
 16
16 -
 17
17 -
 18
18 -
19
-
20
-
21
-
22
-
23
-
24
-
25
-
26
-
27
-
28
-
29
-
30
-
31
-
32
-
33
-
34
-
35
-
36
-
37
-
38
-
39
-
40
-
41
-
42
-
43
-
44
-
45
-
46
-
47
-
48
-
49
-
50
-
51
-
52
-
53
-
54
-
55
-
56
-
57
-
58
-
59
-
60
-
61
-
62
-
63
-
64
-
65
-
66
-
67
-
68
-
69
-
70
-
71
-
72
-
73
-
74
-
75
-
76
-
77
-
78
-
79
-
80
-
81
-
82
-
83
-
84
-
85
-
86
-
87
-
88
-
89
-
90
-
91
-
92
-
93
-
94
-
95
-
96
-
97
-
98
-
99
-
100
-
101
-
102
-
103
-
104
-
105
-
106
 |
 |
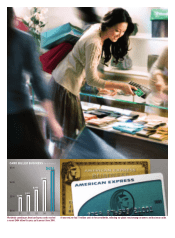
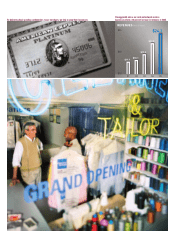
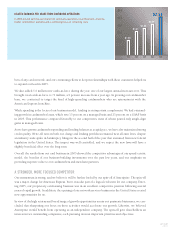
DRIVING GROWTH
No other issuer grew spending on cards faster than American
Express did in 2005. Spending per card is about four times higher
than Visa and MasterCard in the U.S., and the gap is widening.
Innovative new products and services brought in 5.6 million new
cards-in-force last year.
From travel and entertainment, to everyday purchases for gas or groceries, to emerging categories like rent and quick-service
restaurants, we continue to expand the places where customers can use their American Express cards. In 1990, retail and everyday
purchases accounted for only 36 percent of total cardmember spending in the United States. Today, that number is 68 percent.