American Express 2009 Annual Report Download - page 112
Download and view the complete annual report
Please find page 112 of the 2009 American Express annual report below. You can navigate through the pages in the report by either clicking on the pages listed below, or by using the keyword search tool below to find specific information within the annual report.-
 1
1 -
2
-
3
-
4
-
5
-
6
-
7
-
8
-
9
-
10
-
11
-
12
-
13
-
14
-
15
-
16
-
17
-
18
-
19
-
20
-
21
-
22
-
23
-
24
-
25
-
26
-
27
-
28
-
29
-
30
-
31
-
32
-
33
-
34
-
35
-
36
-
37
-
38
-
39
-
40
-
41
-
42
-
43
-
44
-
45
-
46
-
47
-
48
-
49
-
50
-
51
-
52
-
53
-
54
-
55
-
56
-
57
-
58
-
59
-
60
-
61
-
62
-
63
-
64
-
65
-
66
-
67
-
68
-
69
-
70
-
71
-
72
-
73
-
74
-
75
-
76
-
77
-
78
-
79
-
80
-
81
-
82
-
83
-
84
-
85
-
86
-
87
-
88
-
89
-
90
-
91
-
92
-
93
-
94
-
95
-
96
-
97
-
98
-
99
-
100
-
101
-
 102
102 -
 103
103 -
 104
104 -
 105
105 -
 106
106 -
 107
107 -
 108
108 -
 109
109 -
 110
110 -
 111
111 -
 112
112 -
 113
113 -
 114
114 -
 115
115 -
 116
116 -
 117
117 -
 118
118 -
 119
119 -
 120
120 -
 121
121 -
 122
122 -
123
-
124
-
125
-
126
-
127
-
128
-
129
-
130
-
131
-
132
-
133
-
134
 |
 |

NOTES TO CONSOLIDATED FINANCIAL STATEMENTS
AMERICAN EXPRESS COMPANY
NOTE 18
EARNINGS PER COMMON SHARE
The computations of basic and diluted EPS for the years
ended December 31 were as follows:
(Millions, except per share amounts) 2009 2008 2007
Numerator:
Basic and diluted:
Income from continuing operations $2,137 $2,871 $4,126
Preferred shares dividends, accretion,
and recognition of remaining
unaccreted dividends(a) (306) ——
Earnings allocated to participating
share awards and other items (22) (15) (26)
Loss from discontinued operations,
net of tax (7) (172) (114)
Net income attributable to common
shareholders $1,802 $2,684 $3,986
Denominator:
Basic: Weighted-average common
stock 1,168 1,154 1,173
Add: Weighted-average stock options
and warrants(b) 3220
Diluted 1,171 1,156 1,193
Basic EPS(c):
Income from continuing operations
attributable to common
shareholders $ 1.55 $ 2.47 $ 3.49
Loss from discontinued operations (0.01) (0.14) (0.09)
Net income attributable to common
shareholders $ 1.54 $ 2.33 $ 3.40
Diluted EPS(c):
Income from continuing operations
attributable to common
shareholders $ 1.54 $ 2.47 $ 3.44
Loss from discontinued operations —(0.15) (0.10)
Net income attributable to common
shareholders $ 1.54 $ 2.32 $ 3.34
(a) Includes the accelerated preferred dividend accretion of
$212 million for the year ended December 31, 2009, due to the
repurchase of $3.39 billion of preferred shares on June 17, 2009
issued as part of the CPP. Also includes $74 million of preferred
dividends paid and $20 million of preferred dividend accretion
during 2009.
(b) For the years ended December 31, 2009, 2008 and 2007, the
dilutive effect of unexercised stock options excludes 71 million,
45 million and 8 million options, respectively, from the
computation of EPS because inclusion of the options would have
been anti-dilutive.
(c) Effective January 1, 2009, guidance for determining whether
instruments granted in share-based payment transactions are
participating securities requires that restricted stock awards be
included in the computation of basic and diluted EPS pursuant to
the two-class method. Accordingly, the Company has
retrospectively adjusted EPS for 2008 and 2007.
The Subordinated Debentures, discussed in Note 10, would
affect the EPS computation only in the unlikely event the
Company fails to achieve specified performance measures
related to the Company’s tangible common equity and
consolidated net income. In that circumstance the Company
would reflect the additional common shares in the EPS
computation.
NOTE 19
DETAILS OF CERTAIN
CONSOLIDATED STATEMENTS OF
INCOME LINES
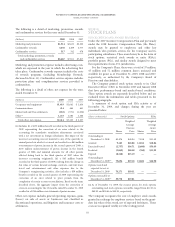
The following is a detail of other commissions and fees for the
years ended December 31:
(Millions) 2009 2008 2007
Foreign currency conversion revenue $ 672 $ 755 $ 718
Delinquency fees 526 852 879
Service fees 335 459 513
Other 245 241 307
Total other commissions and fees $1,778 $2,307 $2,417
The following is a detail of other revenues for the years ended
December 31:
(Millions) 2009 2008 2007
Insurance premium revenue $ 293 $ 326 $ 349
Publishing revenue 224 327 345
Gain on investment securities 225 12 9
Other 1,345 1,492 1,048
Total other revenues $2,087 $2,157 $1,751
Other revenues includes insurance premiums earned from
cardmember travel and other insurance programs, publishing
revenues, revenues arising from contracts with Global
Network Services (GNS) partners including royalties and
signing fees, and other miscellaneous revenue and fees.
110