American Express 2009 Annual Report Download - page 113
Download and view the complete annual report
Please find page 113 of the 2009 American Express annual report below. You can navigate through the pages in the report by either clicking on the pages listed below, or by using the keyword search tool below to find specific information within the annual report.-
 1
1 -
2
-
3
-
4
-
5
-
6
-
7
-
8
-
9
-
10
-
11
-
12
-
13
-
14
-
15
-
16
-
17
-
18
-
19
-
20
-
21
-
22
-
23
-
24
-
25
-
26
-
27
-
28
-
29
-
30
-
31
-
32
-
33
-
34
-
35
-
36
-
37
-
38
-
39
-
40
-
41
-
42
-
43
-
44
-
45
-
46
-
47
-
48
-
49
-
50
-
51
-
52
-
53
-
54
-
55
-
56
-
57
-
58
-
59
-
60
-
61
-
62
-
63
-
64
-
65
-
66
-
67
-
68
-
69
-
70
-
71
-
72
-
73
-
74
-
75
-
76
-
77
-
78
-
79
-
80
-
81
-
82
-
83
-
84
-
85
-
86
-
87
-
88
-
89
-
90
-
91
-
92
-
93
-
94
-
95
-
96
-
97
-
98
-
99
-
100
-
101
-
102
-
 103
103 -
 104
104 -
 105
105 -
 106
106 -
 107
107 -
 108
108 -
 109
109 -
 110
110 -
 111
111 -
 112
112 -
 113
113 -
 114
114 -
 115
115 -
 116
116 -
 117
117 -
 118
118 -
 119
119 -
 120
120 -
 121
121 -
 122
122 -
 123
123 -
124
-
125
-
126
-
127
-
128
-
129
-
130
-
131
-
132
-
133
-
134
 |
 |

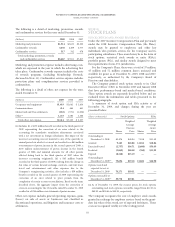
NOTES TO CONSOLIDATED FINANCIAL STATEMENTS
AMERICAN EXPRESS COMPANY
The following is a detail of marketing, promotion, rewards
and cardmember services for the years ended December 31:
(Millions) 2009 2008 2007
Marketing and promotion $1,914 $2,430 $2,562
Cardmember rewards 4,036 4,389 4,777
Cardmember services 517 542 478
Total marketing, promotion, rewards
and cardmember services $6,467 $7,361 $7,817
Marketing and promotion expense includes advertising costs,
which are expensed in the year in which the advertising first
takes place. Cardmember rewards expense includes the costs
of rewards programs (including Membership Rewards,
discussed in Note 11). Cardmember services expense includes
protection plans and complimentary services provided to
cardmembers.
The following is a detail of other, net expense for the years
ended December 31:
(Millions) 2009 2008 2007
Occupancy and equipment $1,619 $1,641 $ 1,436
Communications 414 466 461
MasterCard and Visa settlements (852) (571) (1,056)
Other(a) 1,233 1,586 1,386
Total other, net expense $2,414 $3,122 $ 2,227
(a) Includes (i) a $135 million benefit recorded in the third quarter of
2009 representing the correction of an error related to the
accounting for cumulative translation adjustments associated
with a net investment in foreign subsidiaries (the impact of the
incorrect accounting was not material to any of the quarterly or
annual periods in which it occurred and resulted in a $60 million
overstatement of pretax income in the second quarter of 2009, a
$135 million understatement of pretax income in the fourth
quarter of 2008 and minimal amounts for all other periods
affected dating back to the third quarter of 2007 when the
incorrect accounting originated), (ii) a $45 million benefit
recorded in the third quarter of 2009 resulting from the change in
fair value of certain forward exchange contracts, and (iii) lower
travel and entertainment and other expenses due to the
Company’s reengineering activities. Also includes a $59 million
benefit recorded in the second quarter of 2009 representing the
correction of an error related to prior periods from the
completion of certain account reconciliations. Based on the items
described above, the aggregate impact from the correction of
errors in accounting for the 12 months ended December 31, 2009
resulted in a $254 million overstatement of pretax income.
Other, net expense includes general operating expenses, gains
(losses) on sale of assets or businesses not classified as
discontinued operations, and litigation and insurance costs or
settlements.
NOTE 20
STOCK PLANS
STOCK OPTION AND AWARD PROGRAMS
Under the 2007 Incentive Compensation Plan and previously
under the 1998 Incentive Compensation Plan (the Plans),
awards may be granted to employees and other key
individuals who perform services for the Company and its
participating subsidiaries. These awards may be in the form of
stock options, restricted stock awards or units (RSAs),
portfolio grants (PGs), and similar awards designed to meet
the requirements of non-U.S. jurisdictions.
For the Company’s Plans, there were a total of 37 million,
45 million and 52 million common shares unissued and
available for grant as of December 31, 2009, 2008 and 2007,
respectively, as authorized by the Company’s Board of
Directors and shareholders.
The Company granted stock option awards to its Chief
Executive Officer (CEO) in November 2007 and January 2008
that have performance-based and market-based conditions.
These option awards are separately described below and are
excluded from the information and tables presented in the
following paragraphs.
A summary of stock option and RSA activity as of
December 31, 2009, and changes during the year are
presented below:
(Shares in thousands) Stock Options RSAs
Shares
Weighted
Average
Exercise
Price Shares
Weighted
Average
Grant
Price
Outstanding at
December 31, 2008 83,674 $40.94 7,108 $51.49
Granted 9,165 $18.88 12,014 $18.04
Exercised/vested (2,757) $36.71 (2,680) $50.89
Forfeited (2,060) $40.58 (760) $31.82
Expired (8,328) $35.19 — —
Outstanding at
December 31, 2009(a) 79,694 $39.18 15,682 $26.90
Options vested and
expected to vest at
December 31, 2009 78,271 $39.31 — —
Options exercisable at
December 31, 2009(a) 59,778 $39.81 — —
(a) As of December 31, 2009, the exercise prices for stock options
outstanding and stock options exercisable ranged from $12.06 to
$60.95 and $24.66 to $60.95, respectively.
The Company recognizes the cost of employee stock awards
granted in exchange for employee services based on the grant-
date fair value of the award, net of expected forfeitures. Those
costs are recognized ratably over the vesting period.
111