American Express 2009 Annual Report Download - page 118
Download and view the complete annual report
Please find page 118 of the 2009 American Express annual report below. You can navigate through the pages in the report by either clicking on the pages listed below, or by using the keyword search tool below to find specific information within the annual report.-
 1
1 -
2
-
3
-
4
-
5
-
6
-
7
-
8
-
9
-
10
-
11
-
12
-
13
-
14
-
15
-
16
-
17
-
18
-
19
-
20
-
21
-
22
-
23
-
24
-
25
-
26
-
27
-
28
-
29
-
30
-
31
-
32
-
33
-
34
-
35
-
36
-
37
-
38
-
39
-
40
-
41
-
42
-
43
-
44
-
45
-
46
-
47
-
48
-
49
-
50
-
51
-
52
-
53
-
54
-
55
-
56
-
57
-
58
-
59
-
60
-
61
-
62
-
63
-
64
-
65
-
66
-
67
-
68
-
69
-
70
-
71
-
72
-
73
-
74
-
75
-
76
-
77
-
78
-
79
-
80
-
81
-
82
-
83
-
84
-
85
-
86
-
87
-
88
-
89
-
90
-
91
-
92
-
93
-
94
-
95
-
96
-
97
-
98
-
99
-
100
-
101
-
102
-
103
-
104
-
105
-
106
-
107
-
 108
108 -
 109
109 -
 110
110 -
 111
111 -
 112
112 -
 113
113 -
 114
114 -
 115
115 -
 116
116 -
 117
117 -
 118
118 -
 119
119 -
 120
120 -
 121
121 -
 122
122 -
 123
123 -
 124
124 -
 125
125 -
 126
126 -
 127
127 -
 128
128 -
129
-
130
-
131
-
132
-
133
-
134
 |
 |

NOTES TO CONSOLIDATED FINANCIAL STATEMENTS
AMERICAN EXPRESS COMPANY
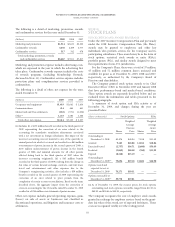
The following table summarizes the target allocation and categorization of all defined benefit pension plan assets measured at fair
value on a recurring basis by GAAP’s valuation hierarchy as of December 31, 2009.
Asset Category
(millions, except percentages)
Target
Allocation 2010 Total
Quoted Prices in
Active Markets
for Identical
Assets
(Level 1)
Significant
Observable
Inputs
(Level 2)
Significant
Unobservable
Inputs
(Level 3)
U.S. equity securities 15% $ 334 $334 $ — $—
International equity securities(a) 30% 626 626 — —
U.S. fixed income securities 30% 553 — 553 —
International fixed income securities(a) 15% 301 — 301 —
Balanced funds 5% 62 — 62 —
Cash —15 15— —
Other(b)
Private equity 52 — — 52
Real estate 38 — — 38
Hedge funds 8——8
Total other 5% 98 — — 98
Total 100% $1,989 $975 $916 $98
(a) A significant portion of international investments are in U.K. companies and U.K. government and agency securities.
(b) Measured at reported net asset value in accordance with GAAP adopted in 2009.
The fair value measurement of all defined benefit pension plan assets using significant unobservable inputs (Level 3) changed
during 2009 due to the following:
(Millions) Total Private Equity Real Estate Hedge Funds
Beginning fair value, January 1, 2009 $187 $64 $60 $63
Actual net losses on plan assets:
Held at the end of the year (38) (16) (19) (3)
Sold during the year (10) — (1) (9)
Total net losses (48) (16) (20) (12)
Net purchases, sales and settlements (41) 4 (2) (43)
Net decrease (89) (12) (22) (55)
Ending fair value, December 31, 2009 $ 98 $52 $38 $8
116