American Express 2009 Annual Report Download - page 2
Download and view the complete annual report
Please find page 2 of the 2009 American Express annual report below. You can navigate through the pages in the report by either clicking on the pages listed below, or by using the keyword search tool below to find specific information within the annual report.-
 1
1 -
 2
2 -
 3
3 -
 4
4 -
 5
5 -
 6
6 -
 7
7 -
 8
8 -
 9
9 -
 10
10 -
 11
11 -
 12
12 -
 13
13 -
14
-
15
-
16
-
17
-
18
-
19
-
20
-
21
-
22
-
23
-
24
-
25
-
26
-
27
-
28
-
29
-
30
-
31
-
32
-
33
-
34
-
35
-
36
-
37
-
38
-
39
-
40
-
41
-
42
-
43
-
44
-
45
-
46
-
47
-
48
-
49
-
50
-
51
-
52
-
53
-
54
-
55
-
56
-
57
-
58
-
59
-
60
-
61
-
62
-
63
-
64
-
65
-
66
-
67
-
68
-
69
-
70
-
71
-
72
-
73
-
74
-
75
-
76
-
77
-
78
-
79
-
80
-
81
-
82
-
83
-
84
-
85
-
86
-
87
-
88
-
89
-
90
-
91
-
92
-
93
-
94
-
95
-
96
-
97
-
98
-
99
-
100
-
101
-
102
-
103
-
104
-
105
-
106
-
107
-
108
-
109
-
110
-
111
-
112
-
113
-
114
-
115
-
116
-
117
-
118
-
119
-
120
-
121
-
122
-
123
-
124
-
125
-
126
-
127
-
128
-
129
-
130
-
131
-
132
-
133
-
134
 |
 |

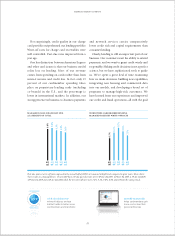
TOTAL REVENUES
NET OF INTEREST EXPENSE
(in billions)
0908070605
$22.1
$24.8
$27.6
$28.4
$24.5
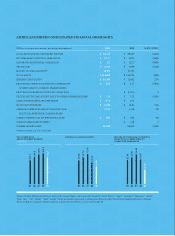
AMERICAN EXPRESS CONSOLIDATED FINANCIAL HIGHLIGHTS
Various forward-looking statements are made in this Annual Report, which generally include the words “believe,” “expect,” “anticipate,” “optimistic,” “intend,”
“plan,” “aim,” “will,” “should,” “could,” “would,” “likely,” and similar expressions. Certain factors that may aect these forward-looking statements, including
American Express Company’s ability to achieve its goals referred to herein, are discussed on page 63.
(Millions, except per share amounts, percentages and employees)
TOTAL REVENUES NET OF INTEREST EXPENSE
INCOME FROM CONTINUING OPERATIONS
LOSS FROM DISCONTINUED OPERATIONS
NET INCOME
RETURN ON AVERAGE EQUITY
TOTAL ASSETS
SHAREHOLDERS’ EQUITY
DILUTED INCOME FROM CONTINUING OPERATIONS
ATTRIBUTABLE TO COMMON SHAREHOLDERS
DILUTED LOSS FROM DISCONTINUED OPERATIONS
DILUTED NET INCOME ATTRIBUTABLE TO COMMON SHAREHOLDERS
CASH DIVIDENDS DECLARED PER SHARE
BOOK VALUE PER SHARE
AVERAGE COMMON SHARES OUTSTANDING FOR
DILUTED EARNINGS PER COMMON SHARE
COMMON SHARE CASH DIVIDENDS DECLARED
COMMON SHARE REPURCHASES
NUMBER OF EMPLOYEES
# denotes a variance of more than 100%
2008
28,365
2,871
(172)
2,699
22.3%
126,074
11,841
2.47
(0.15)
2.32
0.72
10.21
1,156
836
218
66,000
% INC/(DEC)
(14)%
(26)%
(96)%
(21)%
(2)%
22%
(38)%
#
(34)%
—
18%
1%
2%
#
(12)%
2009
24,523
2,137
(7)
2,130
14.6%
124,088
14,406
1.54
—
1.54
0.72
12.08
1,171
855
—
58,300
$
$
$
$
$
$
$
$
$
$
$
$
$
$
$
$
$
$
$
$
$
$
$
$
0908070605
$2.38
$2.91
$3.44
$2.47
$1.54
DILUTED INCOME FROM CONTINUING
OPERATIONS ATTRIBUTABLE TO
COMMON SHAREHOLDERS
RETURN ON AVERAGE EQUITY
0908070605
25.4%
34.7%
37.3%
22.3%
14.6%