American Express 2009 Annual Report Download - page 122
Download and view the complete annual report
Please find page 122 of the 2009 American Express annual report below. You can navigate through the pages in the report by either clicking on the pages listed below, or by using the keyword search tool below to find specific information within the annual report.-
 1
1 -
2
-
3
-
4
-
5
-
6
-
7
-
8
-
9
-
10
-
11
-
12
-
13
-
14
-
15
-
16
-
17
-
18
-
19
-
20
-
21
-
22
-
23
-
24
-
25
-
26
-
27
-
28
-
29
-
30
-
31
-
32
-
33
-
34
-
35
-
36
-
37
-
38
-
39
-
40
-
41
-
42
-
43
-
44
-
45
-
46
-
47
-
48
-
49
-
50
-
51
-
52
-
53
-
54
-
55
-
56
-
57
-
58
-
59
-
60
-
61
-
62
-
63
-
64
-
65
-
66
-
67
-
68
-
69
-
70
-
71
-
72
-
73
-
74
-
75
-
76
-
77
-
78
-
79
-
80
-
81
-
82
-
83
-
84
-
85
-
86
-
87
-
88
-
89
-
90
-
91
-
92
-
93
-
94
-
95
-
96
-
97
-
98
-
99
-
100
-
101
-
102
-
103
-
104
-
105
-
106
-
107
-
108
-
109
-
110
-
111
-
 112
112 -
 113
113 -
 114
114 -
 115
115 -
 116
116 -
 117
117 -
 118
118 -
 119
119 -
 120
120 -
 121
121 -
 122
122 -
 123
123 -
 124
124 -
 125
125 -
 126
126 -
 127
127 -
 128
128 -
 129
129 -
 130
130 -
 131
131 -
 132
132 -
133
-
134
 |
 |

NOTES TO CONSOLIDATED FINANCIAL STATEMENTS
AMERICAN EXPRESS COMPANY
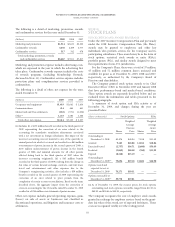
The following table presents the regulatory capital ratios for the Company and the Banks at December 31, 2009 and 2008:
(Millions, except percentages)
Tier 1
capital
Total
capital
Tier 1
capital
ratio
Total
capital
ratio
Tier 1
leverage
ratio(a)
December 31, 2009
American Express Company $11,464 $13,894 9.8% 11.9% 9.7%
American Express Centurion Bank(b) $ 4,430 $ 4,841 13.7% 15.0% 17.1%
American Express Bank, FSB(b) $ 4,784 $ 5,623 14.2% 16.7% 15.1%(a)
December 31, 2008
American Express Company $10,087 $11,610 9.7% 11.1% 8.5%
American Express Centurion Bank $ 3,029 $ 3,386 12.3% 13.7% 13.2%
American Express Bank, FSB $ 3,415 $ 3,767 12.7% 14.0% 12.2%(a)
Well-capitalized ratios(c) 6.0% 10.0% 5.0%(d)
Minimum capital ratios(c) 4.0% 8.0% 4.0%
(a) FSB leverage ratio represents Tier 1 core capital ratio, calculated similarly to Tier 1 leverage ratio.
(b) Since January 2009, FSB has committed to maintain a Total capital ratio of no less than 15 percent. During 2009, enhancements were made
to the American Express Credit Account Master Trust used to securitize credit card receivables issued by both the FSB and Centurion Bank.
As a result of these enhancements, the Banks began holding capital against their off balance sheet trust assets. The Company infused $1.4
billion and $475 million of additional capital into FSB and Centurion Bank, respectively, during 2009 and in connection with the foregoing
increased capital commitment for FSB and the impact of the trust enhancements for both FSB and Centurion Bank.
(c) As defined by the regulations issued by the Federal Reserve, Office of the Comptroller of the Currency (OCC), OTS and FDIC.
(d) Represents requirements for banking subsidiaries to be considered “well capitalized” pursuant to regulations issued under the Federal
Deposit Insurance Corporation Improvement Act. There is no “well capitalized” definition for the Tier 1 leverage ratio for a bank holding
company.
RESTRICTED NET ASSETS OF SUBSIDIARIES
Certain of the Company’s subsidiaries are subject to
restrictions on the transfer of net assets under debt
agreements and regulatory requirements. These restrictions
have not had any effect on the Company’s shareholder
dividend policy and management does not anticipate any
impact in the future. Procedures exist to transfer net assets
between the Company and its subsidiaries, while ensuring
compliance with the various contractual and regulatory
constraints. At December 31, 2009, the aggregate amount of
net assets of subsidiaries that are restricted to be transferred to
American Express’ Parent Company (Parent Company) was
approximately $9.5 billion.
BANK HOLDING COMPANY DIVIDEND RESTRICTIONS
The Company is limited in its ability to pay dividends by its
regulators who could prohibit a dividend that would be
considered an unsafe or unsound banking practice. It is the
policy of the Federal Reserve that bank holding companies
should generally pay dividends on common stock only out of
net income attributable to common shareholders over the
past year, and only if prospective earnings retention is
consistent with the organization’s current and expected future
capital needs, asset quality, and overall financial condition.
Moreover, bank holding companies should not maintain
dividend levels that undermine a company’s ability to be a
source of strength to its banking subsidiaries.
BANKS’ DIVIDEND RESTRICTIONS
In the years ended December 31, 2008 and 2007, Centurion
Bank paid dividends from retained earnings to its parent of
$650 million and $700 million, respectively, which were
eliminated in the Company’s consolidation. No dividends
were paid in 2009. In the years ended December 31, 2008 and
2007, FSB paid dividends from retained earnings to its parent
of $150 million and $150 million, respectively, which were
eliminated in the Company’s consolidation. No dividends
were paid in 2009. As of December 31, 2009 and 2008, the
Banks could pay, in the aggregate, $1.3 billion and $0.6
billion, respectively, in dividends to their bank holding
companies without the prior approval of their respective
banking regulators. In determining the dividends, the Banks
must also consider its effect on applicable risk-based capital
and leverage ratio requirements, as well as policy statements
of the federal regulatory agencies.
120