American Express 2010 Annual Report Download - page 105
Download and view the complete annual report
Please find page 105 of the 2010 American Express annual report below. You can navigate through the pages in the report by either clicking on the pages listed below, or by using the keyword search tool below to find specific information within the annual report.-
 1
1 -
2
-
3
-
4
-
5
-
6
-
7
-
8
-
9
-
10
-
11
-
12
-
13
-
14
-
15
-
16
-
17
-
18
-
19
-
20
-
21
-
22
-
23
-
24
-
25
-
26
-
27
-
28
-
29
-
30
-
31
-
32
-
33
-
34
-
35
-
36
-
37
-
38
-
39
-
40
-
41
-
42
-
43
-
44
-
45
-
46
-
47
-
48
-
49
-
50
-
51
-
52
-
53
-
54
-
55
-
56
-
57
-
58
-
59
-
60
-
61
-
62
-
63
-
64
-
65
-
66
-
67
-
68
-
69
-
70
-
71
-
72
-
73
-
74
-
75
-
76
-
77
-
78
-
79
-
80
-
81
-
82
-
83
-
84
-
85
-
86
-
87
-
88
-
89
-
90
-
91
-
92
-
93
-
94
-
 95
95 -
 96
96 -
 97
97 -
 98
98 -
 99
99 -
 100
100 -
 101
101 -
 102
102 -
 103
103 -
 104
104 -
 105
105 -
 106
106 -
 107
107 -
 108
108 -
 109
109 -
 110
110 -
 111
111 -
 112
112 -
 113
113 -
 114
114 -
 115
115 -
116
-
117
-
118
-
119
-
120
-
121
-
122
-
123
-
124
-
125
-
126
-
127
 |
 |

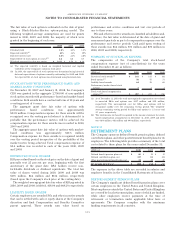
NOTE 18
EARNINGS PER COMMON SHARE
The computations of basic and diluted EPS for the years ended
December 31 were as follows:
(Millions, except per share amounts) 2010 2009 2008
Numerator:
Basic and diluted:
Income from continuing operations $ 4,057 $ 2,137 $ 2,871
Preferred shares dividends, accretion
and recognition of remaining
unaccreted dividends
(a)
—(306) —
Earnings allocated to participating
share awards and other items
(b)
(51) (22) (15)
Loss from discontinued operations,
net of tax —(7) (172)
Net income attributable to common
shareholders $ 4,006 $ 1,802 $ 2,684
Denominator:
Basic: Weighted-average common stock 1,188 1,168 1,154
Add: Weighted-average stock options
and warrants
(c)
732
Diluted 1,195 1,171 1,156
Basic EPS:
Income from continuing operations
attributable to common shareholders $ 3.37 $ 1.55 $ 2.47
Loss from discontinued operations —(0.01) (0.14)
Net income attributable to common
shareholders $ 3.37 $ 1.54 $ 2.33
Diluted EPS:
Income from continuing operations
attributable to common shareholders $ 3.35 $ 1.54 $ 2.47
Loss from discontinued operations —— (0.15)
Net income attributable to common
shareholders $ 3.35 $ 1.54 $ 2.32
(a) Includes the accelerated preferred dividend accretion of $212 million for the
year ended December 31, 2009, due to the repurchase of $3.39 billion of
preferred shares on June 17, 2009 issued as part of the CPP. Also includes
$74 million of preferred dividends paid and $20 million of preferred
dividend accretion during 2009.
(b) The Company’s unvested restricted stock awards, which include the right to
receive non-forfeitable dividends or dividend equivalents, are considered
participating securities. Calculations of EPS under the two-class method
(i) exclude any dividends paid or owed on participating securities and any
undistributed earnings considered to be attributable to participating
securities from the numerator and (ii) exclude the participating securities
from the denominator.
(c) For the years ended December 31, 2010, 2009 and 2008, the dilutive effect of
unexercised stock options excludes 36 million, 71 million and 45 million
options, respectively, from the computation of EPS because inclusion of the
options would have been anti-dilutive.
Subordinated debentures of $750 million issued by the
Company in 2006 would affect the EPS computation only in
the unlikely event the Company fails to achieve specified
performance measures related to the Company’s tangible
common equity and consolidated net income. In that
circumstance the Company would reflect the additional
common shares in the EPS computation.
NOTE 19
DETAILS OF CERTAIN CONSOLIDATED
STATEMENTS OF INCOME LINES
The following is a detail of other commissions and fees for the
years ended December 31:
(Millions) 2010 2009 2008
Foreign currency conversion revenue $ 838 $ 672 $ 755
Delinquency fees 605 526 852
Service fees 328 335 459
Other 260 245 241
Total other commissions and fees $ 2,031 $ 1,778 $ 2,307
The following is a detail of other revenues for the years ended
December 31:
(Millions) 2010 2009 2008
Global Network Services partner revenues $ 530 $ 463 $ 420
Insurance premium revenue 255 293 326
Publishing revenue 228 224 327
(Loss) Gain on investment securities (5) 225 12
Other 919 882 1,072
Total other revenues $ 1,927 $ 2,087 $ 2,157
Other revenues include insurance premiums earned from
cardmember travel and other insurance programs, publishing
revenues, revenues arising from contracts with Global Network
Services (GNS) partners including royalties and signing fees, and
other miscellaneous revenue and fees.
The following is a detail of marketing, promotion, rewards and
cardmember services for the years ended December 31:
(Millions) 2010 2009 2008
Marketing and promotion $ 3,054 $ 1,914 $ 2,430
Cardmember rewards 5,029 4,036 4,389
Cardmember services 561 517 542
Total marketing, promotion, rewards
and cardmember services $ 8,644 $ 6,467 $ 7,361
Marketing and promotion expense includes advertising costs,
which are expensed in the year in which the advertising first
takes place. Cardmember rewards expense includes the costs of
rewards programs (including Membership Rewards, discussed
in Note 11). Cardmember services expense includes protection
plans and complimentary services provided to cardmembers.
103
AMERICAN EXPRESS COMPANY
NOTES TO CONSOLIDATED FINANCIAL STATEMENTS