American Express 2010 Annual Report Download - page 117
Download and view the complete annual report
Please find page 117 of the 2010 American Express annual report below. You can navigate through the pages in the report by either clicking on the pages listed below, or by using the keyword search tool below to find specific information within the annual report.-
 1
1 -
2
-
3
-
4
-
5
-
6
-
7
-
8
-
9
-
10
-
11
-
12
-
13
-
14
-
15
-
16
-
17
-
18
-
19
-
20
-
21
-
22
-
23
-
24
-
25
-
26
-
27
-
28
-
29
-
30
-
31
-
32
-
33
-
34
-
35
-
36
-
37
-
38
-
39
-
40
-
41
-
42
-
43
-
44
-
45
-
46
-
47
-
48
-
49
-
50
-
51
-
52
-
53
-
54
-
55
-
56
-
57
-
58
-
59
-
60
-
61
-
62
-
63
-
64
-
65
-
66
-
67
-
68
-
69
-
70
-
71
-
72
-
73
-
74
-
75
-
76
-
77
-
78
-
79
-
80
-
81
-
82
-
83
-
84
-
85
-
86
-
87
-
88
-
89
-
90
-
91
-
92
-
93
-
94
-
95
-
96
-
97
-
98
-
99
-
100
-
101
-
102
-
103
-
104
-
105
-
106
-
 107
107 -
 108
108 -
 109
109 -
 110
110 -
 111
111 -
 112
112 -
 113
113 -
 114
114 -
 115
115 -
 116
116 -
 117
117 -
 118
118 -
 119
119 -
 120
120 -
 121
121 -
 122
122 -
 123
123 -
 124
124 -
 125
125 -
 126
126 -
 127
127
 |
 |

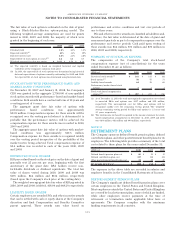
The following table presents certain selected financial information as of December 31, 2010, 2009 and 2008 and for each of the years
then ended:
(Millions, except where indicated) USCS ICS GCS GNMS
Corporate &
Other
(a)
Consolidated
2010
Non-interest revenues $ 10,038 $ 3,685 $ 4,622 $ 4,169 $ 436 $ 22,950
Interest income 5,390 1,393 7 4 498 7,292
Interest expense 812 428 227 (200) 1,156 2,423
Total revenues net of interest expense 14,616 4,650 4,402 4,373 (222) 27,819
Total provision 1,591 392 158 61 5 2,207
Pretax income (loss) from continuing operations 3,537 638 761 1,649 (621) 5,964
Income tax provision (benefit) 1,291 72 287 586 (329) 1,907
Income (loss) from continuing operations $ 2,246 $ 566 $ 474 $ 1,063 $ (292) $ 4,057
Total equity (billions) $ 7.4 $ 2.2 $ 3.7 $ 1.9 $ 1.0 $ 16.2
2009
Non-interest revenues $ 9,505 $ 3,447 $ 4,158 $ 3,602 $ 687 $ 21,399
Interest income 3,216 1,509 5 1 600 5,331
Interest expense 568 427 180 (177) 1,209 2,207
Total revenues net of interest expense 12,153 4,529 3,983 3,780 78 24,523
Total provision 3,769 1,211 177 135 21 5,313
Pretax income (loss) from continuing operations 586 276 505 1,445 29 2,841
Income tax provision (benefit) 175 (56) 155 508 (78) 704
Income (loss) from continuing operations $ 411 $ 332 $ 350 $ 937 $ 107 $ 2,137
Total equity (billions) $ 6.0 $ 2.3 $ 3.7 $ 1.4 $ 1.0 $ 14.4
2008
Non-interest revenues $ 11,415 $ 3,782 $ 5,082 $ 3,863 $ 577 $ 24,719
Interest income 4,425 1,720 6 — 1,050 7,201
Interest expense 1,641 770 471 (328) 1,001 3,555
Total revenues net of interest expense 14,199 4,732 4,617 4,191 626 28,365
Total provision 4,389 1,030 231 127 21 5,798
Pretax income (loss) from continuing operations 1,343 104 614 1,579 (59) 3,581
Income tax provision (benefit) 365 (217) 160 529 (127) 710
Income (loss) from continuing operations $ 978 $ 321 $ 454 $ 1,050 $ 68 $ 2,871
Total equity (billions) $ 4.2 $ 2.2 $ 3.6 $ 1.2 $ 0.6 $ 11.8
(a) Corporate & Other includes adjustments and eliminations for intersegment activity.
Total Revenues Net of Interest Expense
The Company allocates discount revenue and certain other
revenues among segments using a transfer pricing
methodology. Segments earn discount revenue based on the
volume of merchant business generated by cardmembers.
Within the USCS, ICS and GCS segments, discount revenue
reflects the issuer component of the overall discount rate; within
the GNMS segment, discount revenue reflects the network and
merchant component of the overall discount rate. Total interest
income and net card fees are directly attributable to the segment
in which they are reported.
Provisions for Losses
The provisions for losses are directly attributable to the segment
in which they are reported.
Expenses
Marketing, promotion, rewards and cardmember services
expenses are reflected in each segment based on actual
expenses incurred, with the exception of brand advertising,
which is reflected in the GNMS segment. Rewards and
cardmember services expenses are reflected in each segment
based on actual expenses incurred within each segment. Salaries
and employee benefits and other operating expenses reflect
expenses such as professional services, occupancy and
equipment and communications incurred directly within each
segment. In addition, expenses related to the Company’s support
services, such as technology costs, are allocated to each segment
based on support service activities directly attributable to
the segment.
115
AMERICAN EXPRESS COMPANY
NOTES TO CONSOLIDATED FINANCIAL STATEMENTS