American Express 2010 Annual Report Download - page 106
Download and view the complete annual report
Please find page 106 of the 2010 American Express annual report below. You can navigate through the pages in the report by either clicking on the pages listed below, or by using the keyword search tool below to find specific information within the annual report.-
 1
1 -
2
-
3
-
4
-
5
-
6
-
7
-
8
-
9
-
10
-
11
-
12
-
13
-
14
-
15
-
16
-
17
-
18
-
19
-
20
-
21
-
22
-
23
-
24
-
25
-
26
-
27
-
28
-
29
-
30
-
31
-
32
-
33
-
34
-
35
-
36
-
37
-
38
-
39
-
40
-
41
-
42
-
43
-
44
-
45
-
46
-
47
-
48
-
49
-
50
-
51
-
52
-
53
-
54
-
55
-
56
-
57
-
58
-
59
-
60
-
61
-
62
-
63
-
64
-
65
-
66
-
67
-
68
-
69
-
70
-
71
-
72
-
73
-
74
-
75
-
76
-
77
-
78
-
79
-
80
-
81
-
82
-
83
-
84
-
85
-
86
-
87
-
88
-
89
-
90
-
91
-
92
-
93
-
94
-
95
-
 96
96 -
 97
97 -
 98
98 -
 99
99 -
 100
100 -
 101
101 -
 102
102 -
 103
103 -
 104
104 -
 105
105 -
 106
106 -
 107
107 -
 108
108 -
 109
109 -
 110
110 -
 111
111 -
 112
112 -
 113
113 -
 114
114 -
 115
115 -
 116
116 -
117
-
118
-
119
-
120
-
121
-
122
-
123
-
124
-
125
-
126
-
127
 |
 |

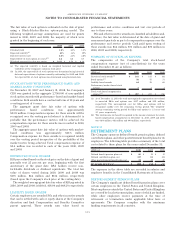
The following is a detail of other, net expense for the years ended
December 31:
(Millions) 2010 2009 2008
Occupancy and equipment $ 1,562 $ 1,619 $ 1,641
Communications 383 414 466
MasterCard and Visa settlements (852) (852) (571)
Other
(a)
1,539 1,233 1,586
Total other, net expense $ 2,632 $ 2,414 $ 3,122
(a) Includes in 2009, (i) a $135 million benefit representing the correction of an
error related to the accounting for cumulative translation adjustments
associated with a net investment in foreign subsidiaries, (ii) a $45 million
benefit resulting from the change in the fair value of certain forward
exchange contracts, (iii) a $59 million benefit related to the completion
of certain account reconciliations and (iv) lower travel and entertainment
and other expenses due to the Company’s reengineering activities.
Other, net expense includes general operating expenses, gains
(losses) on sale of assets or businesses not classified as
discontinued operations, and litigation and insurance costs
or settlements.
NOTE 20
STOCK PLANS
STOCK OPTION AND AWARD PROGRAMS
Under the 2007 Incentive Compensation Plan and previously
under the 1998 Incentive Compensation Plan, awards may be
granted to employees and other key individuals who perform
services for the Company and its participating subsidiaries.
These awards may be in the form of stock options, restricted
stock awards or units (RSAs), portfolio grants (PGs) or other
incentives, and similar awards designed to meet the
requirements of non-U.S. jurisdictions.
For the Company’s Incentive Compensation Plans, there were
a total of 40 million, 37 million and 45 million common shares
unissued and available for grant as of December 31, 2010, 2009
and 2008, respectively, as authorized by the Company’s Board of
Directors and shareholders.
The Company granted stock option awards to its Chief
Executive Officer (CEO) in November 2007 and January
2008 that have performance-based and market-based
conditions. These option awards are separately described and
are excluded from the information and tables presented in the
following paragraphs.
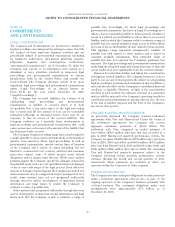
A summary of stock option and RSA activity as of December 31,
2010, and changes during the year ended is presented below:
(Shares in thousands) Shares
Weighted-
Average
Exercise
Price Shares
Weighted-
Average
Grant
Price
Stock Options RSAs
Outstanding as of
December 31, 2009 79,694 $ 39.18 15,682 $26.90
Granted 3,205 $ 37.11 4,886 $38.63
Exercised/vested (16,987) $ 36.45 (4,586) $ 31.70
Forfeited (975) $ 42.82 (908) $ 27.81
Expired (7,974) $ 41.09 — —
Outstanding as of
December 31, 2010 56,963 $ 39.54 15,074 $28.97
Options vested and
expected to vest as of
December 31, 2010 56,681 $ 39.59 — —
Options exercisable as of
December 31, 2010 44,871 $ 40.88 — —
The Company recognizes the cost of employee stock awards
granted in exchange for employee services based on the grant-
date fair value of the award, net of expected forfeitures. Those
costs are recognized ratably over the vesting period.
STOCK OPTIONS
Each stock option has an exercise price equal to the market price
of the Company’s common stock on the date of grant and a
contractual term of 10 years from the date of grant. Stock
options generally vest 25 percent per year beginning with the
first anniversary of the grant date.
The weighted-average remaining contractual life and the
aggregate intrinsic value (the amount by which the fair value
of the Company’s stock exceeds the exercise price of the option)
of the stock options outstanding, exercisable, and vested and
expected to vest as of December 31, 2010 were as follows:
Outstanding Exercisable
Vested and
Expected to
Vest
Weighted-average remaining
contractual life (in years) 4.6 3.7 4.6
Aggregate intrinsic value (millions) $ 390 $ 251 $ 386
The intrinsic value for options exercised during 2010, 2009 and
2008 was $130 million, $11 million and $79 million, respectively
(based upon the fair value of the Company’s stock price at the
date of exercise). Cash received from the exercise of stock
options in 2010, 2009 and 2008 was $619 million,
$83 million and $176 million, respectively. The tax benefit
realized from income tax deductions from stock option
exercises, which was recorded in additional paid-in capital, in
2010, 2009 and 2008 was $35 million, $2 million and
$21 million, respectively.
104
AMERICAN EXPRESS COMPANY
NOTES TO CONSOLIDATED FINANCIAL STATEMENTS