American Express 2010 Annual Report Download - page 112
Download and view the complete annual report
Please find page 112 of the 2010 American Express annual report below. You can navigate through the pages in the report by either clicking on the pages listed below, or by using the keyword search tool below to find specific information within the annual report.-
 1
1 -
2
-
3
-
4
-
5
-
6
-
7
-
8
-
9
-
10
-
11
-
12
-
13
-
14
-
15
-
16
-
17
-
18
-
19
-
20
-
21
-
22
-
23
-
24
-
25
-
26
-
27
-
28
-
29
-
30
-
31
-
32
-
33
-
34
-
35
-
36
-
37
-
38
-
39
-
40
-
41
-
42
-
43
-
44
-
45
-
46
-
47
-
48
-
49
-
50
-
51
-
52
-
53
-
54
-
55
-
56
-
57
-
58
-
59
-
60
-
61
-
62
-
63
-
64
-
65
-
66
-
67
-
68
-
69
-
70
-
71
-
72
-
73
-
74
-
75
-
76
-
77
-
78
-
79
-
80
-
81
-
82
-
83
-
84
-
85
-
86
-
87
-
88
-
89
-
90
-
91
-
92
-
93
-
94
-
95
-
96
-
97
-
98
-
99
-
100
-
101
-
 102
102 -
 103
103 -
 104
104 -
 105
105 -
 106
106 -
 107
107 -
 108
108 -
 109
109 -
 110
110 -
 111
111 -
 112
112 -
 113
113 -
 114
114 -
 115
115 -
 116
116 -
 117
117 -
 118
118 -
 119
119 -
 120
120 -
 121
121 -
 122
122 -
123
-
124
-
125
-
126
-
127
 |
 |

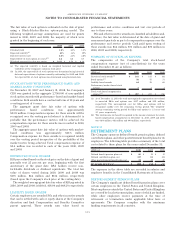
The components of the net periodic benefit cost for all other
postretirement benefit plans for the years ended December 31
were as follows:
(Millions) 2010 2009 2008
Service cost $6$5$6
Interest cost 17 18 19
Amortization of prior service cost —(2) (2)
Recognized net actuarial loss 224
Curtailment loss —6—
Net periodic benefit cost $25$29$27
ASSUMPTIONS
The weighted-average assumptions used to determine benefit
obligations were:
2010 2009
Discount rates 5.2% 5.4%
Health care cost increase rate:
Following year 8.5% 8.0%
Decreasing to the year 2018 5.0% 5.0%
The weighted-average discount rate used to determine net
periodic benefit cost was 5.4 percent, 6.0 percent and
6.1 percent in 2010, 2009 and 2008, respectively. The
discount rate assumption is determined by using a model
consisting of bond portfolios that match the cash flows of the
plan’s projected benefit payments. Use of the rate produced by
this model generates a projected benefit obligation that equals
the current market value of a portfolio of high-quality zero-
coupon bonds whose maturity dates and amounts match the
timing and amount of expected future benefit payments.
A one percentage-point change in assumed health care cost
trend rates would have the following effects:
(Millions) 2010 2009 2010 2009
One
percentage-
point increase
One
percentage-
point decrease
Increase (decrease) on
benefits earned and
interest cost for
U.S. plans $1$1$ (1) $ (1)
Increase (decrease) on
postretirement benefit
obligation for U.S.
plans $15$15$ (13) $ (14)
Benefit Payments
The Company’s other postretirement benefit plans expect to
make benefit payments as follows:
(Millions) 2011 2012 2013 2014 2015
2016
— 2020
Expected payments $ 23 $ 24 $ 24 $ 25 $ 25 $ 128
In addition, the Company expects to contribute $23 million to its
other postretirement benefit plans in 2011.
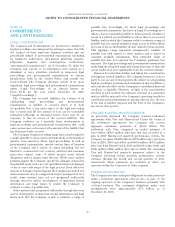
NOTE 22
SIGNIFICANT CREDIT
CONCENTRATIONS
Concentrations of credit risk exist when changes in economic,
industry or geographic factors similarly affect groups of
counterparties whose aggregate credit exposure is material in
relation to American Express’ total credit exposure. The
Company’s customers operate in diverse industries, economic
sectors and geographic regions.
The following table details the Company’s maximum credit
exposure by category, including the credit exposure associated
with derivative financial instruments, as of December 31:
(Billions) 2010 2009
On-balance sheet:
Individuals
(a)
$88$60
Financial institutions
(b)
23 21
U.S. Government and agencies
(c)
12 19
All other
(d)
15 17
Total on-balance sheet
(e)
$ 138 $ 117
Unused lines-of-credit — individuals
(f)
$ 226 $ 222
(a) Individuals primarily include cardmember loans and receivables.
(b) Financial institutions primarily include debt obligations of banks, broker-
dealers, insurance companies and savings and loan associations.
(c) U.S. Government and agencies represent debt obligations of the U.S.
Government and its agencies, states and municipalities and government
sponsored entities.
(d) All other primarily includes cardmember receivables from other
corporate institutions.
(e) Certain distinctions between categories require management judgment.
(f) Because charge card products have no preset spending limit, the associated
credit limit on cardmember receivables is not quantifiable. Therefore, the
quantified unused line-of-credit amounts only include the approximate
credit line available on cardmember loans (including both for on-balance
sheet loans and loans previously securitized).
As of December 31, 2010 and 2009, the Company’s most
significant concentration of credit risk was with individuals,
including cardmember receivables and loans. These amounts
are generally advanced on an unsecured basis. However, the
Company reviews each potential customer’s credit application
and evaluates the applicant’s financial history and ability and
willingness to repay. The Company also considers credit
performance by customer tenure, industry and geographic
location in managing credit exposure.
110
AMERICAN EXPRESS COMPANY
NOTES TO CONSOLIDATED FINANCIAL STATEMENTS