American Express 2010 Annual Report Download - page 86
Download and view the complete annual report
Please find page 86 of the 2010 American Express annual report below. You can navigate through the pages in the report by either clicking on the pages listed below, or by using the keyword search tool below to find specific information within the annual report.-
 1
1 -
2
-
3
-
4
-
5
-
6
-
7
-
8
-
9
-
10
-
11
-
12
-
13
-
14
-
15
-
16
-
17
-
18
-
19
-
20
-
21
-
22
-
23
-
24
-
25
-
26
-
27
-
28
-
29
-
30
-
31
-
32
-
33
-
34
-
35
-
36
-
37
-
38
-
39
-
40
-
41
-
42
-
43
-
44
-
45
-
46
-
47
-
48
-
49
-
50
-
51
-
52
-
53
-
54
-
55
-
56
-
57
-
58
-
59
-
60
-
61
-
62
-
63
-
64
-
65
-
66
-
67
-
68
-
69
-
70
-
71
-
72
-
73
-
74
-
75
-
 76
76 -
 77
77 -
 78
78 -
 79
79 -
 80
80 -
 81
81 -
 82
82 -
 83
83 -
 84
84 -
 85
85 -
 86
86 -
 87
87 -
 88
88 -
 89
89 -
 90
90 -
 91
91 -
 92
92 -
 93
93 -
 94
94 -
 95
95 -
 96
96 -
97
-
98
-
99
-
100
-
101
-
102
-
103
-
104
-
105
-
106
-
107
-
108
-
109
-
110
-
111
-
112
-
113
-
114
-
115
-
116
-
117
-
118
-
119
-
120
-
121
-
122
-
123
-
124
-
125
-
126
-
127
 |
 |

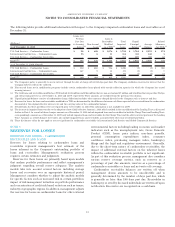
The following table provides information about the Company’s investment securities with gross unrealized losses and the length of time
that individual securities have been in a continuous unrealized loss position as of December 31:
Description of Securities
Estimated
Fair Value
Gross
Unrealized
Losses
Estimated
Fair Value
Gross
Unrealized
Losses
Estimated
Fair Value
Gross
Unrealized
Losses
Estimated
Fair Value
Gross
Unrealized
Losses
Less than 12 months 12 months or more Less than 12 months 12 months or more(Millions)
2010 2009
State and municipal obligations $ 2,535 $ (156) $ 1,076 $ (211) $ 837 $ (25) $ 2,074 $ (233)
U.S. Government agency obligations 299 (1) — — 249 (1) — —
Corporate debt securities — — 3 (1) 102 (1) 38 (11)
Retained subordinated securities ————— — 75 (1)
Mortgage-backed securities 71 (2) — — 120 (2) — —
Total $ 2,905 $ (159) $ 1,079 $ (212) $ 1,308 $ (29) $ 2,187 $ (245)
The following table summarizes the gross unrealized losses due to temporary impairments by ratio of fair value to amortized cost as of
December 31:
Ratio of Fair Value to Amortized Cost
Number of
Securities
Estimated
Fair Value
Gross
Unrealized
Losses
Number of
Securities
Estimated
Fair Value
Gross
Unrealized
Losses
Number of
Securities
Estimated
Fair Value
Gross
Unrealized
Losses
(Millions) Less than 12 months 12 months or more Total
2010:
90%—100% 457 $ 2,554 $ (113) 31 $ 79 $ (7) 488 $ 2,633 $ (120)
Less than 90% 48 351 (46) 115 1,000 (205) 163 1,351 (251)
Total as of December 31, 2010 505 $ 2,905 $ (159) 146 $ 1,079 $ (212) 651 $ 3,984 $ (371)
2009:
90%—100% 155 $ 1,289 $ (25) 225 $ 1,411 $ (87) 380 $ 2,700 $ (112)
Less than 90% 2 19 (4) 78 776 (158) 80 795 (162)
Total as of December 31, 2009 157 $ 1,308 $ (29) 303 $ 2,187 $ (245) 460 $ 3,495 $ (274)
The gross unrealized losses on state and municipal securities
and all other debt securities can be attributed to higher credit
spreads generally for state and municipal securities, higher
credit spreads for specific issuers, changes in market
benchmark interest rates, or a combination thereof, all as
compared to those prevailing when the investment securities
were acquired.
In assessing default risk on these investment securities,
excluding the Company’s retained subordinated securities, the
Company has qualitatively considered the key factors identified
above and determined that it expects to collect all of the
contractual cash flows due on the investment securities. In
assessing default risk on the retained subordinated securities
in 2009, the Company analyzed the projected cash flows of the
Lending Trust and determined that it expected to collect all of
the contractual cash flows due on the investment securities.
Overall, for the investment securities in gross unrealized loss
positions identified above, (a) the Company does not intend to
sell the investment securities, (b) it is more likely than not that
the Company will not be required to sell the investment
securities before recovery of the unrealized losses, and (c) the
Company expects that the contractual principal and interest will
be received on the investment securities. As a result, the
Company recognized no other-than-temporary impairments
during the periods presented.
SUPPLEMENTAL INFORMATION
Gross realized gains and losses on the sales of investment
securities, included in other non-interest revenues, were
as follows:
(Millions) 2010 2009 2008
Gains
(a)
$1$ 226 $ 20
Losses (6) (1) (8)
Total $ (5) $ 225 $ 12
(a) The 2009 gains primarily represent the gain from the sale of 50 percent of
the Company’s investment in ICBC.
Contractual maturities of investment securities, excluding
equity securities and other securities, as of December 31,
2010, were as follows:
(Millions) Cost
Estimated
Fair Value
Due within 1 year $ 6,246 $ 6,253
Due after 1 year but within 5 years 1,110 1,134
Due after 5 years but within 10 years 299 307
Due after 10 years 6,135 5,792
Total $ 13,790 $ 13,486
The expected payments on state and municipal obligations and
mortgage-backed securities may not coincide with their
84
AMERICAN EXPRESS COMPANY
NOTES TO CONSOLIDATED FINANCIAL STATEMENTS