American Express 2010 Annual Report Download - page 111
Download and view the complete annual report
Please find page 111 of the 2010 American Express annual report below. You can navigate through the pages in the report by either clicking on the pages listed below, or by using the keyword search tool below to find specific information within the annual report.-
 1
1 -
2
-
3
-
4
-
5
-
6
-
7
-
8
-
9
-
10
-
11
-
12
-
13
-
14
-
15
-
16
-
17
-
18
-
19
-
20
-
21
-
22
-
23
-
24
-
25
-
26
-
27
-
28
-
29
-
30
-
31
-
32
-
33
-
34
-
35
-
36
-
37
-
38
-
39
-
40
-
41
-
42
-
43
-
44
-
45
-
46
-
47
-
48
-
49
-
50
-
51
-
52
-
53
-
54
-
55
-
56
-
57
-
58
-
59
-
60
-
61
-
62
-
63
-
64
-
65
-
66
-
67
-
68
-
69
-
70
-
71
-
72
-
73
-
74
-
75
-
76
-
77
-
78
-
79
-
80
-
81
-
82
-
83
-
84
-
85
-
86
-
87
-
88
-
89
-
90
-
91
-
92
-
93
-
94
-
95
-
96
-
97
-
98
-
99
-
100
-
 101
101 -
 102
102 -
 103
103 -
 104
104 -
 105
105 -
 106
106 -
 107
107 -
 108
108 -
 109
109 -
 110
110 -
 111
111 -
 112
112 -
 113
113 -
 114
114 -
 115
115 -
 116
116 -
 117
117 -
 118
118 -
 119
119 -
 120
120 -
 121
121 -
122
-
123
-
124
-
125
-
126
-
127
 |
 |

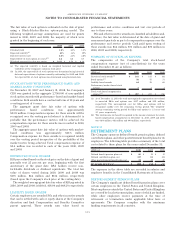
The fair value measurement of all defined benefit pension plan
assets using significant unobservable inputs (Level 3) changed
during the years ended December 31:
(Millions) 2010 2009
Beginning fair value, January 1 $98$ 187
Actual net gains (losses) on plan assets:
Held at the end of the year 11 (38)
Sold during the year —(10)
Total net gains (losses) 11 (48)
Net purchases (sales and settlements) (8) (41)
Net increase (decrease) 3(89)
Ending fair value, December 31 $ 101 $98
Benefit Payments
The Company’s defined benefit pension plans expect to make
benefit payments to retirees as follows:
(Millions) 2011 2012 2013 2014 2015
2016
— 2020
Expected payments $ 145 $ 148 $ 149 $ 155 $ 171 $ 890
In addition, the Company expects to contribute $46 million to
its defined benefit pension plans in 2011.
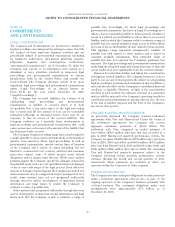
DEFINED CONTRIBUTION RETIREMENT PLANS
The Company sponsors defined contribution retirement plans,
the principal plan being the Retirement Savings Plan (RSP), a
401(k) savings plan with a profit sharing component. The RSP is
a tax-qualified retirement plan subject to ERISA and covers
most employees in the United States. The RSP held 12 million
and 13 million shares of American Express Common Stock as of
December 31, 2010 and 2009, respectively, beneficially for
employees. The Company matches employee contributions to
the plan up to a maximum of 5 percent of total pay, subject to the
limitations under the Internal Revenue Code (IRC). Additional
annual conversion contributions of up to 8 percent of total pay
are provided into the RSP for eligible employees. The Company
also sponsors an RSP RRP, which is an unfunded non-qualified
plan for employees whose RSP benefits are limited by the IRC
and its terms generally parallel those of the RSP. In addition, the
RSP RRP was amended effective January 1, 2011 such that the
Company matches employee contributions up to a maximum of
5 percent of total pay in excess of IRC compensation limits only
to the extent the employee contributes to the plan.
The total expense for all defined contribution retirement
plans globally was $217 million, $118 million and $211 million
in 2010, 2009 and 2008, respectively. The increase in expense in
2010 primarily reflects the Company’s reinstatement in January
of the employer match and conversion contributions.
OTHER POSTRETIREMENT BENEFIT PLANS
The Company sponsors unfunded other postretirement benefit
plans that provide health care and life insurance to certain
retired U.S. employees.
Accumulated Other Comprehensive Loss
The following table provides the amounts comprising
accumulated other comprehensive loss which are not yet
recognized as components of net periodic benefit cost as of
December 31:
(Millions) 2010 2009
Net actuarial loss $50$60
Total, pretax effect 50 60
Tax impact (19) (24)
Total, net of taxes $31$36
The estimated portion of the net actuarial loss above that is
expected to be recognized as a component of net periodic benefit
cost in 2011 is $2 million.
The following table lists the amounts recognized in other
comprehensive loss in 2010:
(Millions) 2010
Net actuarial loss:
Reclassified to earnings from equity $ (2)
Gains in current year (8)
Net actuarial loss, pretax $ (10)
Benefit Obligations
The projected benefit obligation represents a liability based
upon estimated future medical and other benefits to be
provided to retirees.
The following table provides a reconciliation of the changes in
the projected benefit obligation:
(Millions) 2010 2009
Projected benefit obligation, beginning of year $ 324 $ 295
Service cost 65
Interest cost 17 18
Benefits paid (20) (16)
Actuarial (gain) loss (8) 16
Curtailment loss —6
Net change (5) 29
Projected benefit obligation, end of year $ 319 $ 324
The plans are unfunded and the obligations as of December 31,
2010 and 2009 are recognized in the Consolidated Balance
Sheets in other liabilities.
Net Periodic Benefit Cost
GAAP provides for the delayed recognition of the net actuarial
loss and the net prior service credit remaining in accumulated
other comprehensive (loss) income.
109
AMERICAN EXPRESS COMPANY
NOTES TO CONSOLIDATED FINANCIAL STATEMENTS