American Express 2010 Annual Report Download - page 107
Download and view the complete annual report
Please find page 107 of the 2010 American Express annual report below. You can navigate through the pages in the report by either clicking on the pages listed below, or by using the keyword search tool below to find specific information within the annual report.-
 1
1 -
2
-
3
-
4
-
5
-
6
-
7
-
8
-
9
-
10
-
11
-
12
-
13
-
14
-
15
-
16
-
17
-
18
-
19
-
20
-
21
-
22
-
23
-
24
-
25
-
26
-
27
-
28
-
29
-
30
-
31
-
32
-
33
-
34
-
35
-
36
-
37
-
38
-
39
-
40
-
41
-
42
-
43
-
44
-
45
-
46
-
47
-
48
-
49
-
50
-
51
-
52
-
53
-
54
-
55
-
56
-
57
-
58
-
59
-
60
-
61
-
62
-
63
-
64
-
65
-
66
-
67
-
68
-
69
-
70
-
71
-
72
-
73
-
74
-
75
-
76
-
77
-
78
-
79
-
80
-
81
-
82
-
83
-
84
-
85
-
86
-
87
-
88
-
89
-
90
-
91
-
92
-
93
-
94
-
95
-
96
-
 97
97 -
 98
98 -
 99
99 -
 100
100 -
 101
101 -
 102
102 -
 103
103 -
 104
104 -
 105
105 -
 106
106 -
 107
107 -
 108
108 -
 109
109 -
 110
110 -
 111
111 -
 112
112 -
 113
113 -
 114
114 -
 115
115 -
 116
116 -
 117
117 -
118
-
119
-
120
-
121
-
122
-
123
-
124
-
125
-
126
-
127
 |
 |

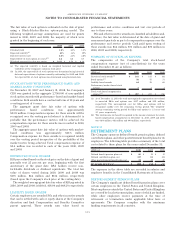
The fair value of each option is estimated on the date of grant
using a Black-Scholes-Merton option-pricing model. The
following weighted-average assumptions are used for grants
issued in 2010, 2009 and 2008, the majority of which were
granted in the beginning of each year:
2010 2009 2008
Dividend yield 1.8% 4.1% 1.5%
Expected volatility
(a)
41% 36% 19%
Risk-free interest rate 2.8% 2.1% 2.8%
Expected life of stock option (in years)
(b)
6.2 4.8 4.7
Weighted-average fair value per option $ 14.11 $ 4.54 $ 8.24
(a) The expected volatility is based on weighted historical and implied
volatilities of the Company’s common stock price.
(b) In 2010, the expected life of stock options was determined using historical
data and expectations of options currently outstanding. In 2009 and 2008,
the expected life of stock options was determined using historical data.
STOCK OPTIONS WITH PERFORMANCE-BASED AND
MARKET-BASED CONDITIONS
On November 30, 2007 and January 31, 2008, the Company’s
CEO was granted in the aggregate 2,750,000 of non-qualified
stock option awards with performance-based and market-based
conditions. Both awards have a contractual term of 10 years and
a vesting period of 6 years.
The aggregate grant date fair value of options with
performance based conditions was approximately
$33.8 million. Compensation expense for these awards will be
recognized over the vesting period when it is determined it is
probable that the performance metrics will be achieved. No
compensation expense for these awards was recorded in 2010,
2009 and 2008.
The aggregate grant date fair value of options with market-
based conditions was approximately $10.5 million.
Compensation expense for these awards is recognized ratably
over the vesting period irrespective of the probability of the
market metric being achieved. Total compensation expense of
$2.4 million was recorded in each of the years 2010, 2009
and 2008.
RESTRICTED STOCK AWARDS
RSAs are valued based on the stock price on the date of grant and
generally vest 25 percent per year, beginning with the first
anniversary of the grant date. RSA holders receive non-
forfeitable dividends or dividend equivalents. The total fair
value of shares vested during 2010, 2009 and 2008 was
$175 million, $44 million and $134 million, respectively
(based upon the Company’s stock price at the vesting date).
The weighted-average grant date fair value of RSAs granted in
2010, 2009 and 2008, is $38.63, $18.04 and $48.29, respectively.
LIABILITY BASED AWARDS
Certain employees are awarded PGs and other incentive awards
that can be settled with cash or equity shares at the Company’s
discretion and final Compensation and Benefits Committee
payout approval. These awards earn value based on
performance and service conditions and vest over periods of
one to three years.
PGs and other incentive awards are classified as liabilities and,
therefore, the fair value is determined at the date of grant and
remeasured quarterly as part of compensation expense over the
performance and service periods. Cash paid upon vesting of
these awards was $64 million, $71 million and $78 million in
2010, 2009 and 2008, respectively.
SUMMARY OF STOCK PLAN EXPENSE
The components of the Company’s total stock-based
compensation expense (net of cancellations) for the years
ended December 31 are as follows:
(Millions) 2010 2009 2008
Restricted stock awards
(a)
$ 163 $ 135 $ 141
Stock options
(a)
58 55 73
Liability-based awards 64 38 40
Performance/market-based stock
options 222
Total stock-based compensation
expense
(b)
$ 287 $ 230 $ 256
(a) As of December 31, 2010, the total unrecognized compensation cost related
to unvested RSAs and options was $257 million and $59 million,
respectively. The unrecognized cost for RSAs and options will be
recognized ratably over the remaining vesting period. The weighted-
average remaining vesting period for RSAs and options is 3.5 years and
2.3 years, respectively.
(b) The total income tax benefit recognized in the income statement for stock-
based compensation arrangements in December 31, 2010, 2009 and 2008
was $100 million, $81 million and $90 million, respectively.
NOTE 21
RETIREMENT PLANS
The Company sponsors defined benefit pension plans, defined
contribution plans, and other postretirement benefit plans for its
employees. The following table provides a summary of the total
cost related to these plans for the years ended December 31:
(Millions) 2010 2009 2008
Defined benefit pension plan cost $40$21$13
Defined contribution plan cost 217 118 211
Other postretirement benefit plan cost 25 29 27
Net periodic benefit cost $ 282 $ 168 $ 251
The expenses in the above table are recorded in salaries and
employee benefits in the Consolidated Statements of Income.
DEFINED BENEFIT PENSION PLANS
The Company’s significant defined benefit pension plans cover
certain employees in the United States and United Kingdom.
Most employees outside the United States and United Kingdom
are covered by local retirement plans, some of which are funded,
while other employees receive payments at the time of
retirement or termination under applicable labor laws or
agreements. The Company complies with the minimum
funding requirements in all countries.
105
AMERICAN EXPRESS COMPANY
NOTES TO CONSOLIDATED FINANCIAL STATEMENTS