Apple 1994 Annual Report Download - page 14
Download and view the complete annual report
Please find page 14 of the 1994 Apple annual report below. You can navigate through the pages in the report by either clicking on the pages listed below, or by using the keyword search tool below to find specific information within the annual report.-
 1
1 -
2
-
3
-
 4
4 -
 5
5 -
 6
6 -
 7
7 -
 8
8 -
 9
9 -
 10
10 -
 11
11 -
 12
12 -
 13
13 -
 14
14 -
 15
15 -
 16
16 -
 17
17 -
 18
18 -
 19
19 -
 20
20 -
 21
21 -
 22
22 -
 23
23 -
 24
24 -
25
-
26
-
27
-
28
-
29
-
30
-
31
-
32
-
33
-
34
-
35
-
36
-
37
-
38
-
39
-
40
-
41
-
42
-
43
-
44
-
45
-
46
-
47
-
48
-
49
-
50
-
51
-
52
-
53
-
54
-
55
-
56
-
57
-
58
-
59
-
60
-
61
-
62
-
63
-
64
-
65
-
66
-
67
-
68
-
69
-
70
-
71
-
72
-
73
 |
 |
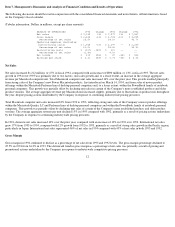
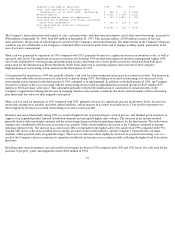
Item 7. Management's Discussion and Analysis of Financial Condition and Results of Operations
The following discussion should be read in conjunction with the consolidated financial statements and notes thereto. All information is based
on the Company's fiscal calendar.
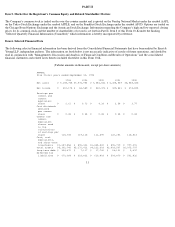
(Tabular information: Dollars in millions, except per share amounts)
Net Sales
Net sales increased $1,212 million, or 15% in fiscal 1994, compared with an increase of $890 million, or 13%, in fiscal 1993. The net sales
growth in 1994 over 1993 was primarily due to two factors: unit sales growth and, to a lesser extent, an increase in the average aggregate
revenue per Macintosh computer unit. Total Macintosh computer unit sales increased 16% over the prior year. This growth resulted principally
from strong sales of the Company's new Power Macintosh products, first introduced on March 14, 1994, and from sales of newer product
offerings within the Macintosh Performa line of desktop personal computers and, to a lesser extent, within the PowerBook family of notebook
personal computers. This growth was partially offset by declining unit sales in certain of the Company's more established products and older
product versions. The average aggregate revenue per Macintosh unit increased slightly, primarily due to fluctuations in product mix throughout
the year, despite pricing actions undertaken by the Company in response to continuing industrywide pricing pressures.
Total Macintosh computer unit sales increased 32% from 1992 to 1993, reflecting strong unit sales of the Company's newer product offerings
within the Macintosh Quadra, LC and Performa lines of desktop personal computers and within the PowerBook family of notebook personal
computers. This growth was partially offset by declining unit sales of certain of the Company's more established products and older product
versions. The average aggregate revenue per unit declined 15% in 1993 compared with 1992, primarily as a result of pricing actions undertaken
by the Company in response to continuing industrywide pricing pressures.
In 1994, domestic net sales increased 14% over the prior year, compared with an increase of 13% in 1993 over 1992. International net sales
grew 17% from 1993 to 1994, compared with 12% growth from 1992 to 1993, primarily as a result of strong sales growth in the Pacific region,
particularly in Japan. International net sales represented 46% of net sales in 1994 compared with 45% of net sales in both 1993 and 1992.
Gross Margin
Gross margin in 1994 continued to decline as a percentage of net sales from 1993 and 1992 levels. The gross margin percentage declined to
25.5% in 1994 from 34.2% in 1993. The downward trend in gross margin as a percentage of net sales was primarily a result of pricing and
promotional actions undertaken by the Company in response to industrywide competitive pricing pressures.
12
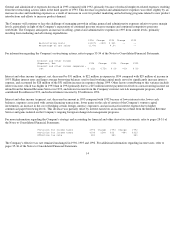
RESULTS OF OPERATIONS 1994 Change 1993 Change 1992
Net sales $ 9,189 15% $ 7,977 13% $ 7,087
Gross margin $ 2,344 -14% $ 2,728 -12% $ 3,095
Percentage of net sales 25.5% 34.2% 43.7%
Operating expenses (excluding
restructuring costs) $ 1,948 -15% $ 2,297 -- $ 2,289
Percentage of net sales 21.2% 28.8% 32.3%
Restructuring costs $ (127) -140% $ 321 -- --
Percentage of net sales (1.4%) 4.0% --
Net income $ 310 258% $ 87 -84% $ 530
Earnings per share $ 2.61 258% $ 0.73 -83% $ 4.33