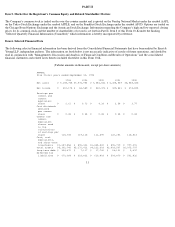
Apple 1994 Annual Report Download - page 15
Download and view the complete annual report
Please find page 15 of the 1994 Apple annual report below. You can navigate through the pages in the report by either clicking on the pages listed below, or by using the keyword search tool below to find specific information within the annual report.-
 1
1 -
2
-
3
-
4
-
 5
5 -
 6
6 -
 7
7 -
 8
8 -
 9
9 -
 10
10 -
 11
11 -
 12
12 -
 13
13 -
 14
14 -
 15
15 -
 16
16 -
 17
17 -
 18
18 -
 19
19 -
 20
20 -
 21
21 -
 22
22 -
 23
23 -
 24
24 -
 25
25 -
26
-
27
-
28
-
29
-
30
-
31
-
32
-
33
-
34
-
35
-
36
-
37
-
38
-
39
-
40
-
41
-
42
-
43
-
44
-
45
-
46
-
47
-
48
-
49
-
50
-
51
-
52
-
53
-
54
-
55
-
56
-
57
-
58
-
59
-
60
-
61
-
62
-
63
-
64
-
65
-
66
-
67
-
68
-
69
-
70
-
71
-
72
-
73
 |
 |
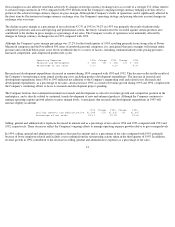
Gross margin was also affected somewhat adversely by changes in foreign currency exchange rates as a result of a stronger U.S. dollar relative
to certain foreign currencies in 1994 compared with 1993. Results from the Company's ongoing foreign currency hedging activities offset a
portion of this adverse foreign currency impact on gross margin. Although the Company's results of operations can be significantly affected in
the short term by fluctuations in foreign currency exchange rates, the Company's operating strategy and pricing take into account changes in
exchange rates over time.
The decline in gross margin as a percentage of net sales from 43.7% in 1992 to 34.2% in 1993 was primarily the result of industrywide
competitive pressures and associated pricing and promotional actions. Inventory valuation reserves recorded against certain products also
contributed to the decline in gross margin as a percentage of net sales. The Company's results of operations were minimally affected by
changes in foreign currency exchange rates in 1993 compared with 1992.
Although the Company's gross margin percentage was 27.2% for the fourth quarter of 1994, resulting primarily from strong sales of Power
Macintosh computers and the PowerBook 500 series of notebook personal computers, it is anticipated that gross margins will remain under
pressure and could fall below prior years' levels worldwide due to a variety of factors, including continued industrywide pricing pressures,
increased competition, and compressed product life cycles.
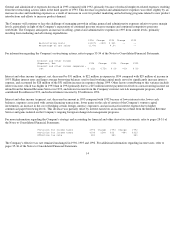
Research and development expenditures decreased in amount during 1994 compared with 1993 and 1992. This decrease reflected the results of
the Company's restructuring actions aimed at reducing costs, including product development expenditures. The increase in research and
development expenditures from 1992 to 1993 reflected net additions to the Company's engineering staff and related costs. Research and
development expenditures, as a percentage of net sales, decreased since 1992 as a result of revenue growth during 1993 and 1994, coupled with
the Company's continuing efforts to focus its research and development project spending.
The Company believes that continued investment in research and development is critical to its future growth and competitive position in the
marketplace, and is directly related to continued, timely development of new and enhanced products. Although the Company continues to
manage operating expense growth relative to gross margin levels, it anticipates that research and development expenditures in 1995 will
increase slightly in amount.
Selling, general and administrative expenses decreased in amount and as a percentage of net sales in 1994 and 1993 compared with 1993 and
1992, respectively. These decreases reflect the Company's ongoing efforts to manage operating expense growth relative to gross margin levels.
In 1994, selling, general and administrative expenses decreased in amount and as a percentage of net sales compared with 1993, primarily
because of lower employee-related and facilities costs resulting from the restructuring actions taken in the third quarter of 1993. In addition,
revenue growth in 1994 contributed to the decrease in selling, general and administrative expenses as a percentage of net sales.
13
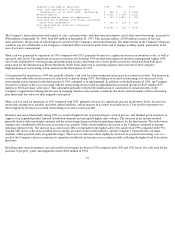
Operating Expenses 1994 Change 1993 Change 1992
Research and development $ 564 -15% $ 665 10% $ 602
Percentage of net sales 6.1% 8.3% 8.5%
1994 Change 1993 Change 1992
Selling, general and administrative $1,384 -15% $1,632 -3% $1,687
Percentage of net sales 15.1% 20.5% 23.8%