Apple 1994 Annual Report Download - page 68
Download and view the complete annual report
Please find page 68 of the 1994 Apple annual report below. You can navigate through the pages in the report by either clicking on the pages listed below, or by using the keyword search tool below to find specific information within the annual report.-
 1
1 -
2
-
3
-
4
-
5
-
6
-
7
-
8
-
9
-
10
-
11
-
12
-
13
-
14
-
15
-
16
-
17
-
18
-
19
-
20
-
21
-
22
-
23
-
24
-
25
-
26
-
27
-
28
-
29
-
30
-
31
-
32
-
33
-
34
-
35
-
36
-
37
-
38
-
39
-
40
-
41
-
42
-
43
-
44
-
45
-
46
-
47
-
48
-
49
-
50
-
51
-
52
-
53
-
54
-
55
-
56
-
57
-
 58
58 -
 59
59 -
 60
60 -
 61
61 -
 62
62 -
 63
63 -
 64
64 -
 65
65 -
 66
66 -
 67
67 -
 68
68 -
 69
69 -
 70
70 -
 71
71 -
 72
72 -
 73
73
 |
 |
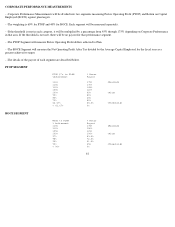
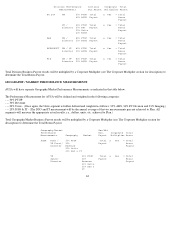
Actual payouts between those shown on the above tables will be calculated on any actual incremental % achievement against plan and will be
rounded to two decimal places.
DETAILS OF BONUS DETERMINATION
If the thresholds are met, the fiscal year-end payout will be calculated in each segment as described above. If the threshold for a segment is not
met, there will be no payout for that performance segment. Plan numbers and actual performance will be monitored by World-Wide Planning.
If for any reason, there is a significant change in a Division or Geography/Market's plan during the plan year, upon joint recommendation of
HR and WW Planning and with the approval of the Chief Executive Officer, plan targets may be changed or another alternative may be
implemented.
If for any reason, including reorganization, a Division or Geography/Market Performance Measurement is no longer applicable for the entire
fiscal year, the Division or Geography/Market Performance Measurement may be replaced by the next higher Division or Geography/Market or
Corporate Performance Measurement.
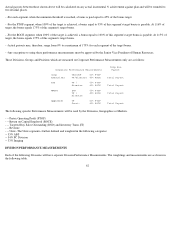
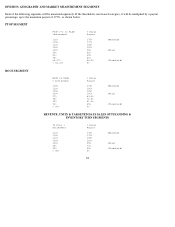
THE CORPORATE MULTIPLIER
For those participants who are measured on Division or Geography/Market Performance Measurements, the combined "Division or
Geography/Market Performance Measurement" bonus payout results will be multiplied by the "Corporate Multiplier" to determine final Total
Company Bonus Payments. The Corporate Multiplier will be calculated as 60% of the PTOP segment and 40% of the ROCE segment of
Corporate performance. For example:
Corporate Multiplier =(120% x 60%=72%) plus (100% x 40% = 40%)=112%
In the aforementioned example, the combined Division or Geography/Market Performance Measurement bonus payout results are multiplied
by 1.12 to calculate the final Total Company Bonus Payment.
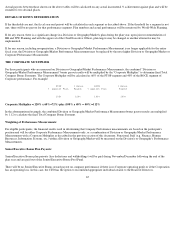
Weighting of Performance Measurements:
For eligible participants, the financial results used in determining the Company Performance measurements are based on the participant's
position and will be either Corporate Performance Measurements only, or a combination of Division or Geography/Market Performance
Measurements with a Corporate Multiplier as described in the previous section of this document. Functional Staff (e.g. Finance, Human
Resources, Information Systems, etc.) within a Division or Geography/Market will be measured on the Division's or Geography's Performance
Measurements.
Senior/Executive Bonus Plan Payouts:
Senior/Executive Bonus plan payouts (less deductions and withholdings) will be paid during November/December following the end of the
plan year and are paid out of the Senior/Executive Bonus Pool Fund.
There will be no Senior/Executive Bonus Award payout on company performance if there is no Corporate operating profit or if the Corporation
has an operating loss. In this case, the CEO has the option to recommend appropriate individual awards to the Board of Directors.
65
PTOP % Bonus ROCE % Bonus
% against Plan Payout % against Plan Payout
105% 120% 100% 100%