Apple 1994 Annual Report Download - page 67
Download and view the complete annual report
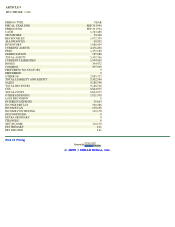
Please find page 67 of the 1994 Apple annual report below. You can navigate through the pages in the report by either clicking on the pages listed below, or by using the keyword search tool below to find specific information within the annual report.-
 1
1 -
2
-
3
-
4
-
5
-
6
-
7
-
8
-
9
-
10
-
11
-
12
-
13
-
14
-
15
-
16
-
17
-
18
-
19
-
20
-
21
-
22
-
23
-
24
-
25
-
26
-
27
-
28
-
29
-
30
-
31
-
32
-
33
-
34
-
35
-
36
-
37
-
38
-
39
-
40
-
41
-
42
-
43
-
44
-
45
-
46
-
47
-
48
-
49
-
50
-
51
-
52
-
53
-
54
-
55
-
56
-
 57
57 -
 58
58 -
 59
59 -
 60
60 -
 61
61 -
 62
62 -
 63
63 -
 64
64 -
 65
65 -
 66
66 -
 67
67 -
 68
68 -
 69
69 -
 70
70 -
 71
71 -
 72
72 -
 73
73
 |
 |
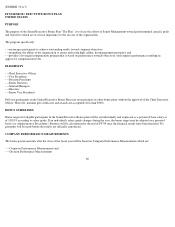
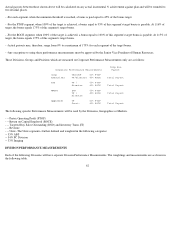
DIVISION, GEOGRAPHY AND MARKET MEASUREMENT SEGMENTS
Each of the following segments will be measured separately. If the threshold is met in each category, it will be multiplied by a payout
percentage, up to the maximum payout of 175%, as shown below.
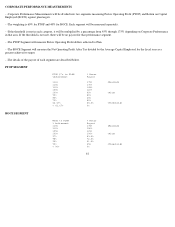
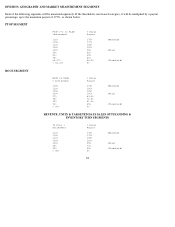
PTOP SEGMENT
ROCE SEGMENT
REVENUE, UNITS & TARGETED DAYS SALES OUTSTANDING &
INVENTORY TURN SEGMENTS
64
PTOP $'s to PLAN % Bonus
%Achievment Payout
116% 175% (Maximum)
115% 170%
110% 145%
105% 120%
100% 95% (Plan)
90% 80%
80% 65%
70% 50%
66.67% 45.5% (Threshold)
< 66.67% 0%
ROCE to PLAN % Bonus
% Achievment Payout
115% 175% (Maximum)
110% 150%
105% 125%
100% 100% (Plan)
97% 83.5%
95% 72.5%
93% 61.5%
90% 45% (Threshold)
< 90% 0%
To Plan % % Bonus
Achievment Payout
116% 175% (Maximum)
115% 170%
110% 145%
105% 120%
100% 95% (Plan)
95% 70%
90% 45% (Threshold)
< 90% 0%