Apple 1994 Annual Report Download - page 29
Download and view the complete annual report
Please find page 29 of the 1994 Apple annual report below. You can navigate through the pages in the report by either clicking on the pages listed below, or by using the keyword search tool below to find specific information within the annual report.-
 1
1 -
2
-
3
-
4
-
5
-
6
-
7
-
8
-
9
-
10
-
11
-
12
-
13
-
14
-
15
-
16
-
17
-
18
-
 19
19 -
 20
20 -
 21
21 -
 22
22 -
 23
23 -
 24
24 -
 25
25 -
 26
26 -
 27
27 -
 28
28 -
 29
29 -
 30
30 -
 31
31 -
 32
32 -
 33
33 -
 34
34 -
 35
35 -
 36
36 -
 37
37 -
 38
38 -
 39
39 -
40
-
41
-
42
-
43
-
44
-
45
-
46
-
47
-
48
-
49
-
50
-
51
-
52
-
53
-
54
-
55
-
56
-
57
-
58
-
59
-
60
-
61
-
62
-
63
-
64
-
65
-
66
-
67
-
68
-
69
-
70
-
71
-
72
-
73
 |
 |
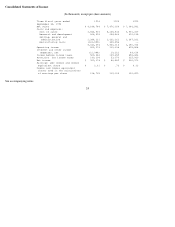
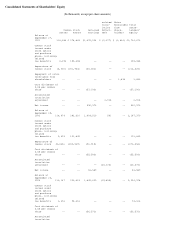
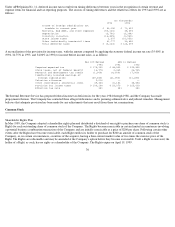
Consolidated Statements of Cash Flows
(In thousands)
See accompanying notes.
26
Three fiscal years ended 1994 1993 1992
September 30, 1994
Cash and cash equivalents,
beginning of the period $ 676,413 $ 498,557 $ 604,147
Operations:
Net income 310,178 86,589 530,373
Adjustments to reconcile net
income to cash generated by
(used for) operations:
Depreciation and amortization 167,958 166,113 217,182
Net book value of property,
plant, and equipment retirements 11,130 13,145 14,687
Changes in assets and liabilities:
Accounts receivable (199,401) (294,761) (180,026)
Inventories 418,204 (926,541) 91,558
Deferred tax assets (24,963) (68,946) 23,841
Other current assets 33,616 (96,314) (87,376)
Accounts payable 139,095 315,686 69,852
Income taxes payable 50,045 (54,724) 100,361
Accrued restructuring costs (249,694) 202,894 (57,327)
Other current liabilities 39,991 (13,383) 96,915
Deferred tax liabilities 40,836 19,029 100,933
Cash generated by (used
for) operations 736,995 (651,213) 920,973
Investments:
Purchase of short-term
investments (312,073) (1,431,998) (2,121,341)
Proceeds from sale of short-term
investments 473,595 2,153,051 1,472,970
Purchase of property, plant, and
equipment (159,587) (213,118) (194,853)
Other (3,737) (15,169) (69,410)
Cash generated by (used
for) investment activities (1,802) 492,766 (912,634)
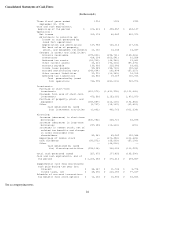
Financing:
Increase (decrease) in short-term
borrowings (530,982) 638,721 35,895
Increase (decrease) in long-term
borrowings 297,355 (10,624) (391)
Increases in common stock, net of
related tax benefits and changes
in notes receivable from
shareholders 82,081 85,289 120,388
Repurchase of common stock -- (273,454) (212,625)
Cash dividends (56,572) (55,593) (57,196)
Other -- (48,036) --
Cash generated by (used
for) financing activities (208,118) 336,303 (113,929)
Total cash generated (used) 527,075 177,856 (105,590)
Cash and cash equivalents, end of
the period $ 1,203,488 $ 676,413 $ 498,557
Supplemental cash flow disclosures:
Cash paid during the year for:
Interest $ 34,387 $ 11,748 $ 8,778
Income taxes, net $ 45,692 $ 226,080 $ 97,667
Schedule of non-cash transactions:
Tax benefit from stock options $ 12,235 $ 16,553 $ 36,836