Apple 1994 Annual Report Download - page 43
Download and view the complete annual report
Please find page 43 of the 1994 Apple annual report below. You can navigate through the pages in the report by either clicking on the pages listed below, or by using the keyword search tool below to find specific information within the annual report.-
 1
1 -
2
-
3
-
4
-
5
-
6
-
7
-
8
-
9
-
10
-
11
-
12
-
13
-
14
-
15
-
16
-
17
-
18
-
19
-
20
-
21
-
22
-
23
-
24
-
25
-
26
-
27
-
28
-
29
-
30
-
31
-
32
-
 33
33 -
 34
34 -
 35
35 -
 36
36 -
 37
37 -
 38
38 -
 39
39 -
 40
40 -
 41
41 -
 42
42 -
 43
43 -
 44
44 -
 45
45 -
 46
46 -
 47
47 -
 48
48 -
 49
49 -
 50
50 -
 51
51 -
 52
52 -
 53
53 -
54
-
55
-
56
-
57
-
58
-
59
-
60
-
61
-
62
-
63
-
64
-
65
-
66
-
67
-
68
-
69
-
70
-
71
-
72
-
73
 |
 |
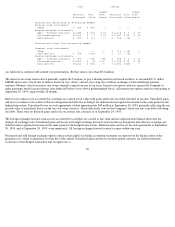
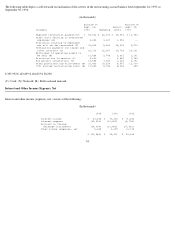
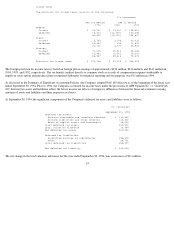
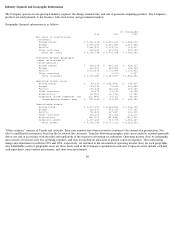
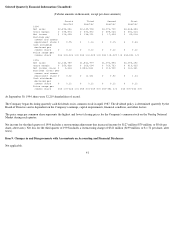
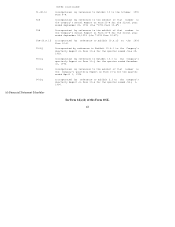
Industry Segment and Geographic Information
The Company operates in one principal industry segment: the design, manufacture, and sale of personal computing products. The Company's
products are sold primarily to the business, education, home, and government markets.
Geographic financial information is as follows:
"Other countries" consists of Canada and Australia. Prior year amounts have been restated to conform to the current year presentation. Net
sales to unaffiliated customers is based on the location of the customers. Transfers between geographic areas are recorded at amounts generally
above cost and in accordance with the rules and regulations of the respective governing tax authorities. Operating income (loss) by geographic
area consists of total net sales less operating expenses, and does not include an allocation of general corporate expenses. The restructuring
charge and adjustment recorded in 1993 and 1994, respectively, are included in the calculation of operating income (loss) for each geographic
area. Identifiable assets of geographic areas are those assets used in the Company's operations in each area. Corporate assets include cash and
cash equivalents, joint venture investments, and short-term investments.
40
(In thousands)
1994 1993 1992
Net sales to unaffiliated
customers:
United States $ 4,982,298 $ 4,387,674 $ 3,885,042
Europe 2,096,257 2,001,593 2,017,840
Pacific 1,581,571 1,075,711 716,517
Other countries 528,622 511,976 467,143
Total net sales $ 9,188,748 $ 7,976,954 $ 7,086,542
Transfers between geographic
areas (eliminated in
consolidation):
United States $ 408,635 $ 420,323 $ 458,167
Europe 234,011 262,554 246,745
Pacific 1,633,413 1,772,440 1,156,433
Other countries -- 2,160 1,237
Total transfers $ 2,276,059 $ 2,457,477 $ 1,862,582
Operating income (loss):
United States $ 45,292 $ (253,499) $ 245,810
Europe 263,190 79,440 301,865
Pacific 197,318 262,426 227,183
Other countries 22,876 24,146 18,998
Eliminations (6,402) (2,175) 11,952
Corporate income (expense), net (21,988) 29,321 49,634
Income before income taxes $ 500,286 $ 139,659 $ 855,442
Identifiable assets:
United States $ 2,317,192 $ 2,534,545 $ 1,536,705
Europe 814,670 973,741 767,765
Pacific 796,803 637,857 341,200
Other countries 165,193 161,332 115,272
Eliminations (58,372) (49,838) (43,716)
Corporate assets 1,267,260 913,775 1,506,467
Total assets $ 5,302,746 $ 5,171,412 $ 4,223,693