Apple 1994 Annual Report Download - page 66
Download and view the complete annual report
Please find page 66 of the 1994 Apple annual report below. You can navigate through the pages in the report by either clicking on the pages listed below, or by using the keyword search tool below to find specific information within the annual report.-
 1
1 -
2
-
3
-
4
-
5
-
6
-
7
-
8
-
9
-
10
-
11
-
12
-
13
-
14
-
15
-
16
-
17
-
18
-
19
-
20
-
21
-
22
-
23
-
24
-
25
-
26
-
27
-
28
-
29
-
30
-
31
-
32
-
33
-
34
-
35
-
36
-
37
-
38
-
39
-
40
-
41
-
42
-
43
-
44
-
45
-
46
-
47
-
48
-
49
-
50
-
51
-
52
-
53
-
54
-
55
-
 56
56 -
 57
57 -
 58
58 -
 59
59 -
 60
60 -
 61
61 -
 62
62 -
 63
63 -
 64
64 -
 65
65 -
 66
66 -
 67
67 -
 68
68 -
 69
69 -
 70
70 -
 71
71 -
 72
72 -
 73
73
 |
 |
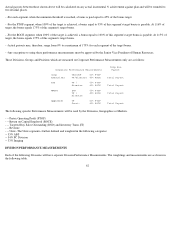
Total Division Business Payout results will be multiplied by a Corporate Multiplier (see The Corporate Multiplier section for description) to
determine the Total Bonus Payout.
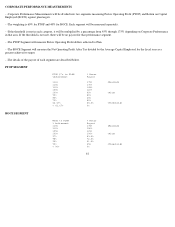
GEOGRAPHY / MARKET PERFORMANCE MEASUREMENTS
AUSA will have separate Geography/Market Performance Measurements as indicated in the table below.
The Performance Measurement for AUSA will be defined and weighted in the following categories:
- -- 30% PTOP
- -- 30% Revenue
- -- 20% Units - (Once again, the Units segment is further defined and weighted as follows: 33% ABS, 34% PC Division and 33% Imaging.)
- -- 20% DSO & IT - (The DSO and IT measurement will be the annual average of the two measurements percent achieved to Plan. All
segments will measure the appropriate actual results, i.e., dollars, units, etc. achieved to Plan.)
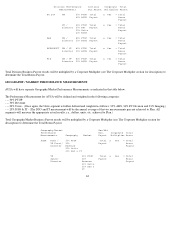
Total Geography/Market Business Payout results will be multiplied by a Corporate Multiplier (see The Corporate Multiplier section for
description) to determine the Total Bonus Payout.
63
Division Performance Division Corporate Total
Measurements Bus.Payout Multiplier Payout
PC DIV GM 60% PTOP Total x Yes = Total
40% ROCE Payout Bonus
Payout
VP / 30% PTOP Total x Yes = Total
Director 30% Rev Payout Bonus
20% Units Payout
20% ROCE
ABS GM / 80% PTOP Total x Yes = Total
Director 20% ROCE Payout Bonus
Payout
APPLESOFT GM / VP 80% PTOP Total x Yes = Total
Director 20% ROCE Payout Bonus
Payout
PIE GM / VP 80% PTOP Total x Yes = Total
Director 20% ROCE Payout Bonus
Payout
Geography/Market Geo/Mkt
Performance Bus. Corporate Total
Measurements Geography Market Payout Multiplier Bonus
AUSA Pres / 30% PTOP Total x Yes = Total
VP Funct/ 30% Payout Bonus
Director Revenue Payout
20% Units
20% DSO & IT
VP 30% PTOP Total x Yes = Total
Sales/ 30% Payout Bonus
Director Revenue Payout
20% Units
20% DSO &
IT