Apple 2000 Annual Report Download - page 15
Download and view the complete annual report
Please find page 15 of the 2000 Apple annual report below. You can navigate through the pages in the report by either clicking on the pages listed below, or by using the keyword search tool below to find specific information within the annual report.-
 1
1 -
2
-
3
-
4
-
 5
5 -
 6
6 -
 7
7 -
 8
8 -
 9
9 -
 10
10 -
 11
11 -
 12
12 -
 13
13 -
 14
14 -
 15
15 -
 16
16 -
 17
17 -
 18
18 -
 19
19 -
 20
20 -
 21
21 -
 22
22 -
 23
23 -
 24
24 -
 25
25 -
26
-
27
-
28
-
29
-
30
-
31
-
32
-
33
-
34
-
35
-
36
-
37
-
38
-
39
-
40
-
41
-
42
-
43
-
44
-
45
-
46
-
47
-
48
-
49
-
50
-
51
-
52
-
53
-
54
-
55
-
56
-
57
-
58
-
59
-
60
-
61
-
62
-
63
-
64
-
65
-
66
-
67
-
68
-
69
-
70
-
71
-
72
-
73
-
74
-
75
-
76
-
77
-
78
-
79
-
80
-
81
-
82
-
83
-
84
-
85
 |
 |
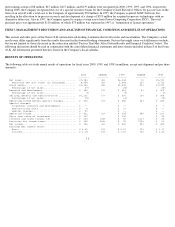
The following table sets forth quarterly results of operations for fiscal 2000 and 1999 (in millions, except unit sales and per share amounts):
FISCAL 2000 OVERVIEW
SALES
During 2000, the Company experienced a 30% increase in net sales over 1999 which was the result of a 32% rise in Macintosh unit sales. This
increase in Macintosh unit sales is primarily attributable to increased sales of iMac, the company's moderately priced desktop Macintosh
system designed for the education and consumer markets, and the introduction of iBook, the Company's consumer and education oriented
notebook computer introduced at the end of 1999. The Company sold approximately 2.2 million iMacs in 2000, an increase of approximately
400,000 units or 22% over iMac unit sales in 1999. During 2000, the Company sold approximately 545,000 iBooks. iBook contributed $809
million to net sales during 2000. The Company also experienced modest gains in combined unit sales of its professionally oriented Macintosh
systems, PowerMacs and PowerBooks. Growth in net sales and unit sales was strong in all of the Company's geographic operating segments,
particularly in Europe and Japan.
PROFITABILITY
The Company experienced improved profitability in 2000. Operating income before special charges rose 61% to $620 million in 2000 from
$386 million in 1999. Improved profitability was driven by the 30% increase in net sales, stable overall gross margins in 2000 as compared to
1999, and a relatively modest increase in operating expenses before special charges of 18%.
OPERATING TRENDS
Despite overall increases during 2000 in net sales, unit sales, and profitability, the Company's performance in the fourth quarter of fiscal 2000
was disappointing. Net sales during the fourth quarter fell short of the Company's expectations by approximately $180 million causing
operating margin before special charges to fall to 4% for the quarter as compared to the 9% experienced during the first nine months of fiscal
2000. The fourth quarter revenue shortfall was primarily the result of three factors. First, fourth quarter net sales
12
YEAR ENDED SEPTEMBER 30, 2000 YEAR ENDED SEPTEMBER 25, 1999
----------------------------------------- -----------------------------------------
FOURTH THIRD SECOND FIRST FOURTH THIRD SECOND FIRST
QUARTER QUARTER QUARTER QUARTER QUARTER QUARTER QUARTER QUARTER
-------- -------- -------- -------- -------- -------- -------- --------
Net sales................... $1,870 $1,825 $1,945 $2,343 $1,336 $1,558 $1,530 $1,710
Macintosh CPU unit sales
(in thousands).......... 1,122 1,016 1,043 1,377 772 905 827 944
Gross margin................ $ 467 $ 543 $ 549 $ 607 $ 384 $ 427 $ 403 $ 482
Gross margin percentage... 25% 30% 28% 26% 29% 27% 26% 28%
Operating expenses.......... $ 383 $ 375 $ 379 $ 409 $ 317 $ 323 $ 315 $ 355
Special charges............. -- -- -- 98 18 -- 9 --
Operating income............ 84 168 170 100 49 104 79 127
Operating margin
percentage.............. 4% 9% 9% 4% 4% 7% 5% 7%
Gains from sales of
investment................ $ 83 $ 50 $ 100 $ 134 $ 42 $ 101 $ 55 $ 32
Interest and other income,
net....................... $ 62 $ 52 $ 49 $ 40 $ 34 $ 24 $ 19 $ 10
Provision for income
taxes..................... $ 59 $ 70 $ 86 $ 91 $ 14 $ 26 $ 18 $ 17
Net income.................. $ 170 $ 200 $ 233 $ 183 $ 111 $ 203 $ 135 $ 152
Earnings per common share:
Basic..................... $ 0.52 $ 0.62 $ 0.72 $ 0.57 $ 0.35 $ 0.70 $ 0.49 $ 0.56
Diluted................... $ 0.47 $ 0.55 $ 0.64 $ 0.51 $ 0.31 $ 0.60 $ 0.42 $ 0.47