Apple 2000 Annual Report Download - page 17
Download and view the complete annual report
Please find page 17 of the 2000 Apple annual report below. You can navigate through the pages in the report by either clicking on the pages listed below, or by using the keyword search tool below to find specific information within the annual report.-
 1
1 -
2
-
3
-
4
-
5
-
6
-
 7
7 -
 8
8 -
 9
9 -
 10
10 -
 11
11 -
 12
12 -
 13
13 -
 14
14 -
 15
15 -
 16
16 -
 17
17 -
 18
18 -
 19
19 -
 20
20 -
 21
21 -
 22
22 -
 23
23 -
 24
24 -
 25
25 -
 26
26 -
 27
27 -
28
-
29
-
30
-
31
-
32
-
33
-
34
-
35
-
36
-
37
-
38
-
39
-
40
-
41
-
42
-
43
-
44
-
45
-
46
-
47
-
48
-
49
-
50
-
51
-
52
-
53
-
54
-
55
-
56
-
57
-
58
-
59
-
60
-
61
-
62
-
63
-
64
-
65
-
66
-
67
-
68
-
69
-
70
-
71
-
72
-
73
-
74
-
75
-
76
-
77
-
78
-
79
-
80
-
81
-
82
-
83
-
84
-
85
 |
 |

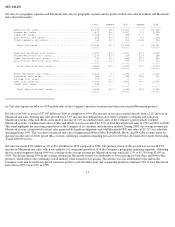
NET SALES
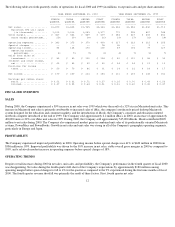
Net sales for geographic segments and Macintosh unit sales by geographic segment and by product follow (net sales in millions and Macintosh
unit sales in thousands):
(a) Unit sales figures for iMac in 1998 include sales of the Company's previous consumer and education oriented Macintosh products.
Net sales rose 30% to a total of $7.983 billion in 2000 as compared to 1999. The increase in net sales resulted directly from a 32% increase in
Macintosh unit sales. Driving unit sales growth was a 51% increase in combined unit sales of the Company's consumer and education
Macintosh systems, iMac and iBook, and a modest increase of 11% in combined units sales of the Company's professionally oriented
Macintosh systems. Combined unit sales of iMac and iBook systems accounted for 52% of total Macintosh unit sales in 1999 and 60% in 2000.
This trend highlights the increasing importance to the Company of its consumer and education markets. During 2000, the average revenue per
Macintosh system, a function of total net sales generated by hardware shipments and total Macintosh CPU unit sales, of $1,715 was relatively
unchanged from 1999. This was due to increased unit sales of higher priced Power Mac, PowerBook, iBook, and G4 Cube systems offset by
increases in unit sales of lower priced iMac systems. Additional comments regarding net sales for 2000 may be found above under the heading
"Fiscal 2000 Overview."
Net sales increased $193 million or 3% to $6.134 billion in 1999 compared to 1998. The primary source of this growth was an overall 25%
increase in Macintosh unit sales, which was reflective of strong unit growth in all of the Company's geographic operating segments. Offsetting
the rise in unit shipments during 1999 was a decline in the average revenue per Macintosh system which fell 17% to $1,739 from $2,095 in
1998. The decline during 1999 in the average revenue per Macintosh system was attributable to lower pricing for both iMac and Power Mac
products, which reflects the continuing overall industry trend towards lower pricing. The decline was also attributable to the shift in the
Company's unit mix toward lower-priced consumer products such that iMac units and comparable products comprised 52% of total Macintosh
unit sales in 1999 versus 39% in 1998.
14
2000 CHANGE 1999 CHANGE 1998
-------- -------- -------- -------- --------
Americas net sales................................... $4,298 22 % $3,527 2 % $3,468
Europe net sales..................................... 1,817 38 % 1,317 2 % 1,295
Japan net sales...................................... 1,345 57 % 858 17 % 731
Asia Pacific net sales............................... 355 16 % 306 4 % 293
Other segments net sales............................. 168 33 % 126 (18)% 154
------ ------ ------
Total net sales.................................... $7,983 30 % $6,134 3 % $5,941
====== ====== ======
Americas Macintosh unit sales........................ 2,507 24 % 2,021 22 % 1,655
Europe Macintosh unit sales.......................... 1,110 53 % 724 23 % 588
Japan Macintosh unit sales........................... 730 39 % 524 35 % 389
Asia Pacific Macintosh unit sales.................... 211 18 % 179 37 % 131
------ ------ ------
Total Macintosh unit sales......................... 4,558 32 % 3,448 25 % 2,763
====== ====== ======
Power Macintosh unit sales........................... 1,329 3 % 1,296 2 % 1,266
PowerBook unit sales................................. 383 11 % 344 (19)% 427
G4 Cube unit sales................................... 107 -- -- -- --
iMac unit sales(a)................................... 2,194 22 % 1,802 68 % 1,070
iBook unit sales..................................... 545 -- 6 -- --
------ ------ ------
Total Macintosh unit sales......................... 4,558 32 % 3,448 25 % 2,763
====== ====== ======