Apple 2000 Annual Report Download - page 18
Download and view the complete annual report
Please find page 18 of the 2000 Apple annual report below. You can navigate through the pages in the report by either clicking on the pages listed below, or by using the keyword search tool below to find specific information within the annual report.-
 1
1 -
2
-
3
-
4
-
5
-
6
-
7
-
 8
8 -
 9
9 -
 10
10 -
 11
11 -
 12
12 -
 13
13 -
 14
14 -
 15
15 -
 16
16 -
 17
17 -
 18
18 -
 19
19 -
 20
20 -
 21
21 -
 22
22 -
 23
23 -
 24
24 -
 25
25 -
 26
26 -
 27
27 -
 28
28 -
29
-
30
-
31
-
32
-
33
-
34
-
35
-
36
-
37
-
38
-
39
-
40
-
41
-
42
-
43
-
44
-
45
-
46
-
47
-
48
-
49
-
50
-
51
-
52
-
53
-
54
-
55
-
56
-
57
-
58
-
59
-
60
-
61
-
62
-
63
-
64
-
65
-
66
-
67
-
68
-
69
-
70
-
71
-
72
-
73
-
74
-
75
-
76
-
77
-
78
-
79
-
80
-
81
-
82
-
83
-
84
-
85
 |
 |
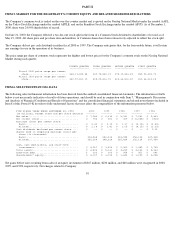
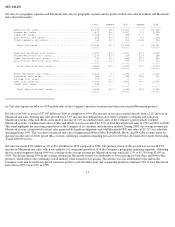
Net sales declined sequentially during the fourth quarter of 1999 compared to the third quarter by $222 million or 14%, and declined $220
million or 14% compared to the same period in 1998. Similarly, Macintosh unit sales declined 15% and 7% during the fourth quarter of 1999
compared to the third quarter of 1999 and the same period in 1998, respectively. The primary causes for these declines in both net sales and
unit sales were lower than planned deliveries of PowerPC G4 processors from Motorola and production interruptions at vendors supplying
PowerBooks and iBooks experienced during the last week of the fourth quarter of 1999 as a result of the earthquake in Taiwan on September
20, 1999. The shortage of G4 processors reduced Power Macintosh net sales by approximately $200 million during the fourth quarter of 1999.
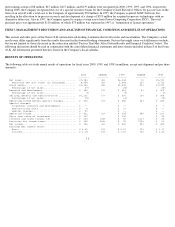
SEGMENT OPERATING PERFORMANCE
The Company manages its business primarily on a geographic basis. The Company's geographic segments include the Americas, Europe,
Japan, and Asia Pacific. The Americas segment includes both North and South America. The European segment includes European countries
as well as the Middle East and Africa. The Japan segment includes only Japan, while the Asia Pacific segment includes Australia and Asia
except for Japan. Each geographic operating segment provides similar hardware and software products and similar services. Further
information regarding the Company's operating segments may be found in Part II, Item 8 on this Form 10-K in the Notes to Consolidated
Financial Statements at Note 10, "Segment Information and Geographic Data," which information is hereby incorporated by reference.
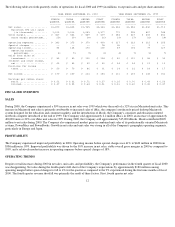
AMERICAS
Net sales and unit sales in the Americas segment increased 22% and 24%, respectively, during 2000 as compared to 1999. During 2000, the
Americas segment represented approximately 54% and 55% of the Company's total net sales and total Macintosh unit sales, respectively. The
growth of the Americas' net sales in 2000 was indicative of strong growth in unit sales of iMac and iBook and relatively flat unit sales of
professionally oriented Macintosh systems.
Net sales in the Americas segment increased 2% to $3.527 billion during 1999 as compared to 1998, while Macintosh unit sales increased 22%.
This followed a 5% decline in net sales in the Americas between 1998 and 1997. During 1999, the Americas segment represented
approximately 57% and 59% of the Company's total net sales and total Macintosh unit sales, respectively. The results experienced by this
segment in 1999 reflect the overall trends experienced by the Company during 1999 of increasing Macintosh unit sales offset by declines in the
average revenue per Macintosh system.
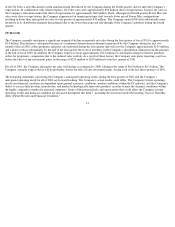
EUROPE
Net sales in the Europe segment increased 38% during 2000 driven by a 53% increase in Macintosh unit sales. Growth in unit sales resulted
from a 96% increase in combined unit sales of iMac and iBook, and an increase of 19% in combined units sales of the Company's
professionally oriented Macintosh systems.
Net sales in the Europe segment increased 2% to $1.317 billion during 1999 as compared to 1998, while Macintosh unit sales increased 23%.
This followed a 16% decline in net sales in the Europe segment between 1998 and 1997. Like the Americas segment, Europe's results in 1999
as compared to 1998 were indicative of strong growth in Macintosh unit sales offset by declines in the average revenue per Macintosh system.
JAPAN AND ASIA PACIFIC
Net sales in the Japan segment increased 57% to $1.345 billion in 2000 as compared to 1999, while Japan's Macintosh unit sales increased
39%. The fact that Japan's net sales rose at a higher rate than its unit sales reflects several factors. First, iMac unit sales in Japan were relatively
flat year-over-year. Second, unit sales of iBook, which generally carry a higher price than iMac units and which were first sold in Japan during
2000, accounted for approximately 17% of Japan's total Macintosh unit sales during 2000. Third, Japan saw a 43% increase in combined unit
sales of the Company's professionally oriented Macintosh systems.
15