Apple 2000 Annual Report Download - page 61
Download and view the complete annual report
Please find page 61 of the 2000 Apple annual report below. You can navigate through the pages in the report by either clicking on the pages listed below, or by using the keyword search tool below to find specific information within the annual report.-
 1
1 -
2
-
3
-
4
-
5
-
6
-
7
-
8
-
9
-
10
-
11
-
12
-
13
-
14
-
15
-
16
-
17
-
18
-
19
-
20
-
21
-
22
-
23
-
24
-
25
-
26
-
27
-
28
-
29
-
30
-
31
-
32
-
33
-
34
-
35
-
36
-
37
-
38
-
39
-
40
-
41
-
42
-
43
-
44
-
45
-
46
-
47
-
48
-
49
-
50
-
 51
51 -
 52
52 -
 53
53 -
 54
54 -
 55
55 -
 56
56 -
 57
57 -
 58
58 -
 59
59 -
 60
60 -
 61
61 -
 62
62 -
 63
63 -
 64
64 -
 65
65 -
 66
66 -
 67
67 -
 68
68 -
 69
69 -
 70
70 -
 71
71 -
72
-
73
-
74
-
75
-
76
-
77
-
78
-
79
-
80
-
81
-
82
-
83
-
84
-
85
 |
 |

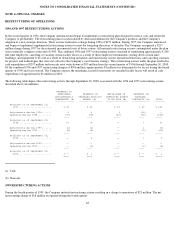
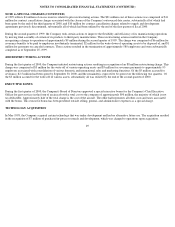
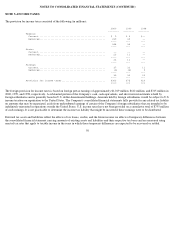
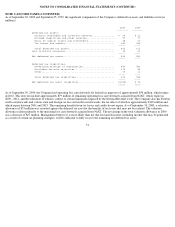
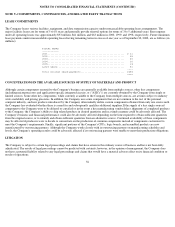
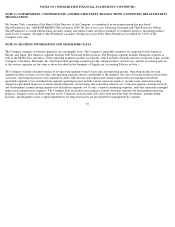
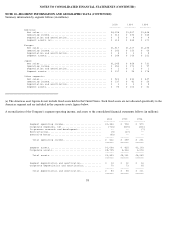
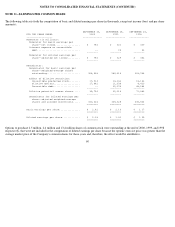
NOTES TO CONSOLIDATED FINANCIAL STATEMENTS (CONTINUED)
NOTE 10--SEGMENT INFORMATION AND GEOGRAPHIC DATA (CONTINUED)
Summary information by segment follows (in millions):
(a) The Americas asset figures do not include fixed assets held in the United States. Such fixed assets are not allocated specifically to the
Americas segment and are included in the corporate assets figures below.
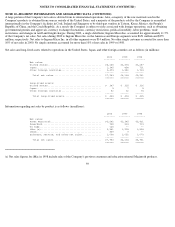
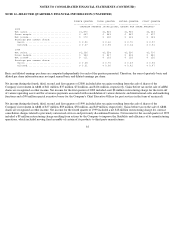
A reconciliation of the Company's segment operating income, and assets to the consolidated financial statements follows (in millions):
58
2000 1999 1998
-------- -------- --------
Americas:
Net sales................................................. $4,298 $3,527 $3,468
Operating income.......................................... $ 614 $ 493 $ 345
Depreciation and amortization............................. $ 5 $ 4 $ 4
Segment assets (a)........................................ $ 618 $ 468 $ 671
Europe:
Net sales................................................. $1,817 $1,317 $1,295
Operating income.......................................... $ 243 $ 156 $ 69
Depreciation and amortization............................. $ 4 $ 3 $ 5
Segment assets............................................ $ 248 $ 169 $ 262
Japan:
Net sales................................................. $1,345 $ 858 $ 731
Operating income.......................................... $ 352 $ 173 $ 97
Depreciation and amortization............................. $ 2 $ 2 $ 2
Segment assets............................................ $ 137 $ 94 $ 178
Other segments:
Net sales................................................. $ 523 $ 432 $ 447
Operating income.......................................... $ 137 $ 82 $ 59
Depreciation and amortization............................. $ 3 $ 3 $ 5
Segment assets............................................ $ 95 $ 104 $ 82
2000 1999 1998
-------- -------- --------
Segment operating income............................ $1,346 $ 904 $ 570
Corporate expenses, net............................. (726) (518) (302)
In-process research and development................. -- -- (7)
Restructuring....................................... (8) (27) --
Executive bonus..................................... (90) -- --
------ ------ ------
Total operating income............................ $ 522 $ 359 $ 261
====== ====== ======
Segment assets...................................... $1,098 $ 835 $1,193
Corporate assets.................................... $5,705 4,326 3,096
------ ------ ------
Total assets...................................... $6,803 $5,161 $4,289
====== ====== ======
Segment depreciation and amortization............... $ 14 $ 12 $ 16
Corporate depreciation and amortization............. 70 73 95
------ ------ ------
Total depreciation and amortization............... $ 84 $ 85 $ 111
====== ====== ======