Apple 2000 Annual Report Download - page 37
Download and view the complete annual report
Please find page 37 of the 2000 Apple annual report below. You can navigate through the pages in the report by either clicking on the pages listed below, or by using the keyword search tool below to find specific information within the annual report.-
 1
1 -
2
-
3
-
4
-
5
-
6
-
7
-
8
-
9
-
10
-
11
-
12
-
13
-
14
-
15
-
16
-
17
-
18
-
19
-
20
-
21
-
22
-
23
-
24
-
25
-
26
-
 27
27 -
 28
28 -
 29
29 -
 30
30 -
 31
31 -
 32
32 -
 33
33 -
 34
34 -
 35
35 -
 36
36 -
 37
37 -
 38
38 -
 39
39 -
 40
40 -
 41
41 -
 42
42 -
 43
43 -
 44
44 -
 45
45 -
 46
46 -
 47
47 -
48
-
49
-
50
-
51
-
52
-
53
-
54
-
55
-
56
-
57
-
58
-
59
-
60
-
61
-
62
-
63
-
64
-
65
-
66
-
67
-
68
-
69
-
70
-
71
-
72
-
73
-
74
-
75
-
76
-
77
-
78
-
79
-
80
-
81
-
82
-
83
-
84
-
85
 |
 |
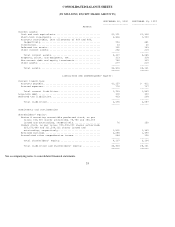
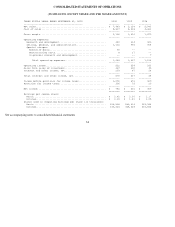
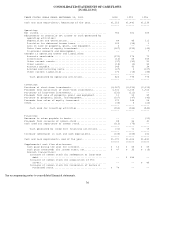
CONSOLIDATED STATEMENTS OF OPERATIONS
(IN MILLIONS, EXCEPT SHARE AND PER SHARE AMOUNTS)
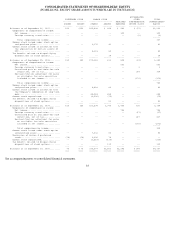
See accompanying notes to consolidated financial statements
34
THREE FISCAL YEARS ENDED SEPTEMBER 30, 2000 2000 1999 1998
------------------------------------------- -------- -------- ---------
Net sales................................................... $ 7,983 $ 6,134 $ 5,941
Cost of sales............................................... 5,817 4,438 4,462
-------- -------- ---------
Gross margin................................................ 2,166 1,696 1,479
-------- -------- ---------
Operating expenses:
Research and development.................................. 380 314 303
Selling, general, and administrative...................... 1,166 996 908
Special charges:
Executive bonus......................................... 90 -- --
Restructuring costs..................................... 8 27 --
In-process research and development..................... -- -- 7
-------- -------- ---------
Total operating expenses.............................. 1,644 1,337 1,218
-------- -------- ---------
Operating income............................................ 522 359 261
Gains from sales of investment.............................. 367 230 40
Interest and other income, net.............................. 203 87 28
-------- -------- ---------
Total interest and other income, net........................ 570 317 68
-------- -------- ---------
Income before provision for income taxes.................... 1,092 676 329
Provision for income taxes.................................. 306 75 20
-------- -------- ---------
Net income.................................................. $ 786 $ 601 $ 309
======== ======== =========
Earnings per common share:
Basic..................................................... $ 2.42 $ 2.10 $ 1.17
Diluted................................................... $ 2.18 $ 1.81 $ 1.05
Shares used in computing earnings per share (in thousands):
Basic..................................................... 324,568 286,314 263,948
Diluted................................................... 360,324 348,328 335,834